QUESTION IMAGE
Question
warm-up temperature in toronto
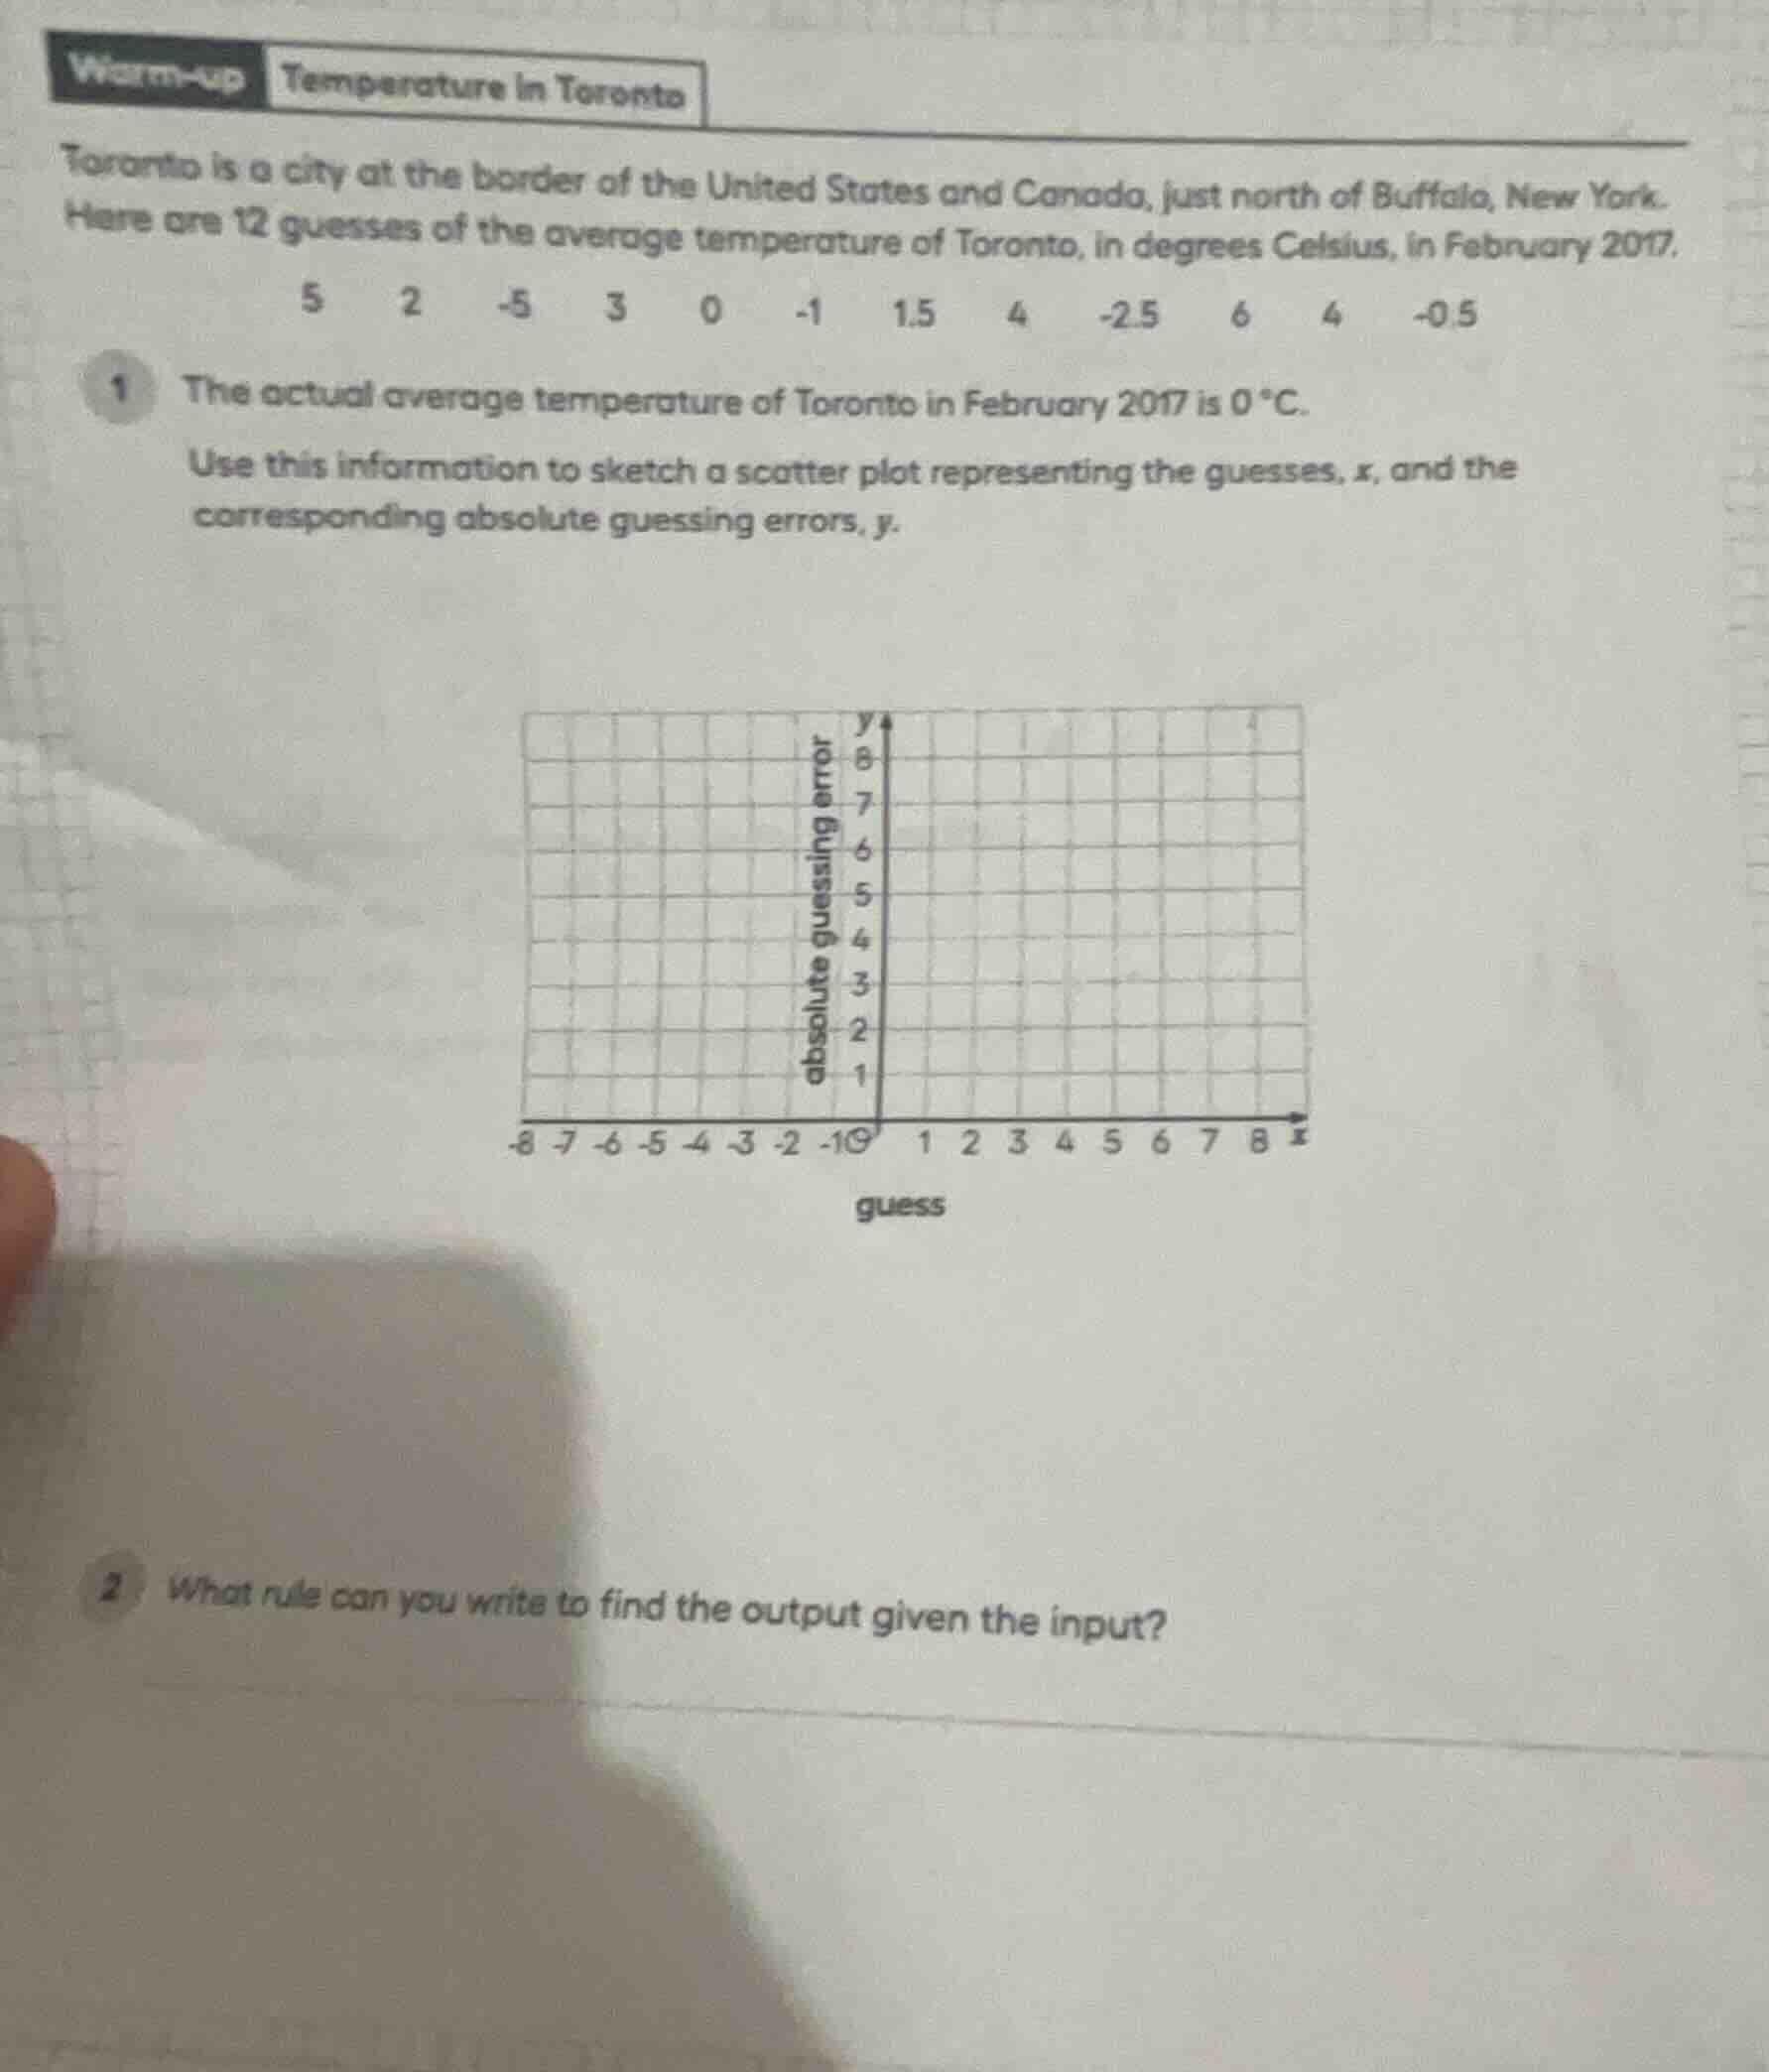
toronto is a city at the border of the united states and canada, just north of buffalo, new york.
here are 12 guesses of the average temperature of toronto, in degrees celsius, in february 2017.
5 2 -5 3 0 -1 1.5 4 -2.5 6 4 -0.5
1 the actual average temperature of toronto in february 2017 is 0 °c.
use this information to sketch a scatter plot representing the guesses, x, and the
corresponding absolute guessing errors, y.
scatter plot with x-axis labeled guess and y-axis labeled absolute guessing error
2 what rule can you write to find the output given the input?
Question 1: Sketching the Scatter Plot
To sketch the scatter plot, we first need to calculate the absolute guessing error for each guess. The absolute error \( y \) for a guess \( x \) (where the actual value is \( 0^\circ \text{C} \)) is given by \( y = |x - 0| = |x| \).
Let's calculate \( y \) for each \( x \):
- For \( x = 5 \): \( y = |5| = 5 \)
- For \( x = 2 \): \( y = |2| = 2 \)
- For \( x = -5 \): \( y = |-5| = 5 \)
- For \( x = 3 \): \( y = |3| = 3 \)
- For \( x = 0 \): \( y = |0| = 0 \)
- For \( x = -1 \): \( y = |-1| = 1 \)
- For \( x = 1.5 \): \( y = |1.5| = 1.5 \)
- For \( x = 4 \): \( y = |4| = 4 \)
- For \( x = -2.5 \): \( y = |-2.5| = 2.5 \)
- For \( x = 6 \): \( y = |6| = 6 \)
- For \( x = 4 \): \( y = |4| = 4 \) (this is a repeated guess, so we plot it again)
- For \( x = -0.5 \): \( y = |-0.5| = 0.5 \)
Now, we plot each point \( (x, y) \) on the given grid:
| \( x \) | \( y \) |
|---|---|
| 2 | 2 |
| -5 | 5 |
| 3 | 3 |
| 0 | 0 |
| -1 | 1 |
| 1.5 | 1.5 |
| 4 | 4 |
| -2.5 | 2.5 |
| 6 | 6 |
| 4 | 4 |
| -0.5 | 0.5 |
To sketch the scatter plot:
- Locate each \( x \)-value on the horizontal axis (guess) and each corresponding \( y \)-value on the vertical axis (absolute guessing error).
- Mark a point for each \( (x, y) \) pair. For example:
- \( (5, 5) \): Find \( x = 5 \) on the horizontal axis and \( y = 5 \) on the vertical axis, mark the point.
- \( (-5, 5) \): Find \( x = -5 \) on the horizontal axis and \( y = 5 \) on the vertical axis, mark the point.
- \( (0, 0) \): This is the origin, mark the point.
- And so on for all the points.
Question 2: Finding the Rule
The input is the guess \( x \) (in degrees Celsius), and the output is the absolute guessing error \( y \). Since the actual temperature is \( 0^\circ \text{C} \), the absolute error is the absolute value of the difference between the guess and the actual value. Mathematically, this is:
\( y = |x - 0| = |x| \)
So the rule to find the output (absolute guessing error) given the input (guess) is: take the absolute value of the guess. In other words, if the input is \( x \), the output \( y \) is \( y = |x| \).
Final Answers
Question 1:
The scatter plot is sketched by plotting the points \( (5, 5) \), \( (2, 2) \), \( (-5, 5) \), \( (3, 3) \), \( (0, 0) \), \( (-1, 1) \), \( (1.5, 1.5) \), \( (4, 4) \), \( (-2.5, 2.5) \), \( (6, 6) \), \( (4, 4) \), and \( (-0.5, 0.5) \) on the provided grid.
Question 2:
The rule is \( y = |x| \), where \( x \) is the guess (input) and \( y \) is the absolute guessing error (output).

Snap & solve any problem in the app
Get step-by-step solutions on Sovi AI
Photo-based solutions with guided steps
Explore more problems and detailed explanations
Question 1: Sketching the Scatter Plot
To sketch the scatter plot, we first need to calculate the absolute guessing error for each guess. The absolute error \( y \) for a guess \( x \) (where the actual value is \( 0^\circ \text{C} \)) is given by \( y = |x - 0| = |x| \).
Let's calculate \( y \) for each \( x \):
- For \( x = 5 \): \( y = |5| = 5 \)
- For \( x = 2 \): \( y = |2| = 2 \)
- For \( x = -5 \): \( y = |-5| = 5 \)
- For \( x = 3 \): \( y = |3| = 3 \)
- For \( x = 0 \): \( y = |0| = 0 \)
- For \( x = -1 \): \( y = |-1| = 1 \)
- For \( x = 1.5 \): \( y = |1.5| = 1.5 \)
- For \( x = 4 \): \( y = |4| = 4 \)
- For \( x = -2.5 \): \( y = |-2.5| = 2.5 \)
- For \( x = 6 \): \( y = |6| = 6 \)
- For \( x = 4 \): \( y = |4| = 4 \) (this is a repeated guess, so we plot it again)
- For \( x = -0.5 \): \( y = |-0.5| = 0.5 \)
Now, we plot each point \( (x, y) \) on the given grid:
| \( x \) | \( y \) |
|---|---|
| 2 | 2 |
| -5 | 5 |
| 3 | 3 |
| 0 | 0 |
| -1 | 1 |
| 1.5 | 1.5 |
| 4 | 4 |
| -2.5 | 2.5 |
| 6 | 6 |
| 4 | 4 |
| -0.5 | 0.5 |
To sketch the scatter plot:
- Locate each \( x \)-value on the horizontal axis (guess) and each corresponding \( y \)-value on the vertical axis (absolute guessing error).
- Mark a point for each \( (x, y) \) pair. For example:
- \( (5, 5) \): Find \( x = 5 \) on the horizontal axis and \( y = 5 \) on the vertical axis, mark the point.
- \( (-5, 5) \): Find \( x = -5 \) on the horizontal axis and \( y = 5 \) on the vertical axis, mark the point.
- \( (0, 0) \): This is the origin, mark the point.
- And so on for all the points.
Question 2: Finding the Rule
The input is the guess \( x \) (in degrees Celsius), and the output is the absolute guessing error \( y \). Since the actual temperature is \( 0^\circ \text{C} \), the absolute error is the absolute value of the difference between the guess and the actual value. Mathematically, this is:
\( y = |x - 0| = |x| \)
So the rule to find the output (absolute guessing error) given the input (guess) is: take the absolute value of the guess. In other words, if the input is \( x \), the output \( y \) is \( y = |x| \).
Final Answers
Question 1:
The scatter plot is sketched by plotting the points \( (5, 5) \), \( (2, 2) \), \( (-5, 5) \), \( (3, 3) \), \( (0, 0) \), \( (-1, 1) \), \( (1.5, 1.5) \), \( (4, 4) \), \( (-2.5, 2.5) \), \( (6, 6) \), \( (4, 4) \), and \( (-0.5, 0.5) \) on the provided grid.
Question 2:
The rule is \( y = |x| \), where \( x \) is the guess (input) and \( y \) is the absolute guessing error (output).