QUESTION IMAGE
Question
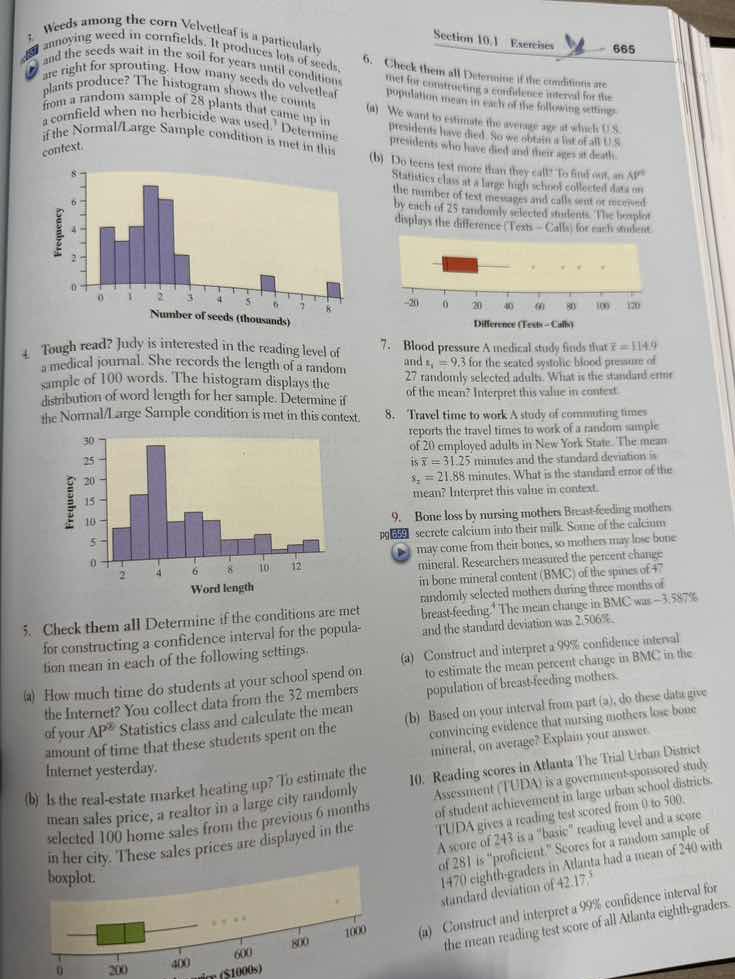
- weeds among the corn velvetleaf is a particularly annoying weed in cornfields. it produces lots of seeds, and the seeds wait for years until conditions are right for sprouting. how many seeds do velvetleaf plants produce? the histogram shows the counts from a random sample of 28 plants that came up in a cornfield when no herbicide was used. determine if the normal/large sample condition is met in this context.
- tough read? judy is interested in the reading level of a medical journal. she records the length of a random sample of 100 words. the histogram displays the distribution of word length for her sample. determine if the normal/large sample condition is met in this context.
- check them all determine if the conditions are met for constructing a confidence interval for the population mean in each of the following settings.
(a) how much time do students at your school spend on the internet? you collect data from the 32 members of your ap® statistics class and calculate the mean amount of time that these students spent on the internet yesterday.
(b) is the real - estate market healing up? to estimate the mean sales price, a realtor in a large city randomly selected 100 home sales from the previous 6 months in her city. these sales prices are displayed in the boxplot.
- check them all determine if the conditions are met for constructing a confidence interval for the population mean in each of the following settings.
(a) we want to estimate the average age at which u.s. presidents have died. so we obtain a list of all u.s. presidents who have died and then a lot of all u.s. presidents who have died and their ages at death.
(b) teens text more than they call? to find out, an ap® statistics class at a large high school collected data on the number of text messages and calls sent or received by each of 25 randomly selected students. the boxplot displays the difference (texts - calls) for each student.
- blood pressure a medical study finds that \\(\bar{x} = 114.9\\) and \\(s_{x}=9.3\\) for the seated systolic blood pressure of 27 randomly selected adults. what is the standard error of the mean? interpret this value in context.
- travel time to work a study of commuting times reports the travel times to work of a random sample of 20 employed adults in new york state. the mean is \\(\bar{x}=31.25\\) minutes and the standard deviation is \\(s_{x}=21.88\\) minutes. what is the standard error of the mean? interpret this value in context.
- bone loss by nursing mothers breast - feeding mothers may secrete calcium into their milk. some of the calcium may come from their bones, so mothers may lose bone mineral. researchers measured the percent change in bone mineral content (bmc) of the spines of 47 randomly selected mothers during three months of breast - feeding. the mean change in bmc was - 3.587% and the standard deviation was 2.506% .
(a) construct and interpret a 99% confidence interval to estimate the mean percent change in bmc in the population of breast - feeding mothers.
(b) based on your interval from part (a), do these data give convincing evidence that nursing mothers lose bone mineral, on average? explain your answer.
- reading scores in atlanta the trial urban district assessment (tuda) is a government - sponsored study of student achievement in large urban school districts. tuda gives a reading test scored from 0 to 500. a score of 243 is a “basic” reading level and a score of 281 is “proficient.” scores for a random sample of 240 eighth - graders in atlanta had a mean of 240 with standard deviation of 42.17 .
(a) construct and interpret a 99% confidence interval for the mean reading test score of all atlanta eighth - graders.
Let's tackle problem 7 first:
Problem 7: Blood pressure for a medical study
We have a sample of \( n = 27 \) adults, sample mean \( \bar{x} = 114.9 \), and sample standard deviation \( s_x = 9.3 \). We need to find the standard error of the mean.
Step 1: Recall the formula for the standard error of the mean
The standard error (SE) of the sample mean is given by:
\( SE = \frac{s}{\sqrt{n}} \)
where \( s \) is the sample standard deviation and \( n \) is the sample size.
Step 2: Plug in the values
Here, \( s = 9.3 \) and \( n = 27 \).
First, calculate \( \sqrt{n} \):
\( \sqrt{27} \approx 5.196 \)
Step 3: Compute the standard error
Now, divide \( s \) by \( \sqrt{n} \):
\( SE = \frac{9.3}{\sqrt{27}} \approx \frac{9.3}{5.196} \approx 1.79 \)
Interpretation
The standard error of the mean is approximately \( 1.79 \). This tells us how much the sample mean (114.9) is likely to vary from the true population mean of blood pressure, due to sampling variability. In other words, if we took many samples of 27 adults and calculated their mean blood pressure, the standard deviation of these sample means would be about 1.79.
Final Answer (for Problem 7)
The standard error of the mean is \( \boldsymbol{\frac{9.3}{\sqrt{27}} \approx 1.79} \).
---
Problem 8: Travel time to work
We have a sample of \( n = 20 \) adults, sample mean \( \bar{x} = 31.25 \) minutes, and sample standard deviation \( s_x = 21.588 \) minutes. We need to find the standard error of the mean.
Step 1: Use the same formula for standard error
\( SE = \frac{s}{\sqrt{n}} \)
Step 2: Plug in the values
Here, \( s = 21.588 \) and \( n = 20 \).
First, calculate \( \sqrt{n} \):
\( \sqrt{20} \approx 4.472 \)
Step 3: Compute the standard error
\( SE = \frac{21.588}{\sqrt{20}} \approx \frac{21.588}{4.472} \approx 4.83 \)
Interpretation
The standard error of the mean is approximately \( 4.83 \) minutes. This means that if we took many samples of 20 commuters and calculated their mean travel time, the standard deviation of these sample means would be about 4.83 minutes.
Final Answer (for Problem 8)
The standard error of the mean is \( \boldsymbol{\frac{21.588}{\sqrt{20}} \approx 4.83} \) minutes.
---
Problem 9(a): Confidence interval for bone mineral change
We have a sample of \( n = 47 \) breastfeeding mothers, sample mean \( \bar{x} = -3.587\% \), sample standard deviation \( s = 2.5063\% \). We need to construct a 99% confidence interval for the population mean.
Step 1: Recall the formula for a confidence interval for the mean (t-interval, since \( \sigma \) is unknown)
The formula is:
\( \bar{x} \pm t^* \cdot \frac{s}{\sqrt{n}} \)
where \( t^* \) is the critical value from the t-distribution with \( df = n - 1 \), \( \bar{x} \) is the sample mean, \( s \) is the sample standard deviation, and \( n \) is the sample size.
Step 2: Find the critical value \( t^* \)
For a 99% confidence interval and \( df = 47 - 1 = 46 \), we use a t-table or calculator. Using a t-table or technology, \( t^* \approx 2.687 \) (for 99% confidence and \( df = 46 \)).
Step 3: Calculate the margin of error (ME)
\( ME = t^* \cdot \frac{s}{\sqrt{n}} \)
Plug in the values:
\( \frac{s}{\sqrt{n}} = \frac{2.5063}{\sqrt{47}} \approx \frac{2.5063}{6.8557} \approx 0.3656 \)
Then, \( ME = 2.687 \cdot 0.3656 \approx 0.982 \)
Step 4: Construct the confidence interval
Lower bound: \( \bar{x} - ME = -3.587 - 0.982 = -4.569 \)
Upper bound: \( \bar{x} + ME = -3.587 + 0.982 = -2.605 \)
Interpretation
We are 99% confident that the…

Snap & solve any problem in the app
Get step-by-step solutions on Sovi AI
Photo-based solutions with guided steps
Explore more problems and detailed explanations
Let's tackle problem 7 first:
Problem 7: Blood pressure for a medical study
We have a sample of \( n = 27 \) adults, sample mean \( \bar{x} = 114.9 \), and sample standard deviation \( s_x = 9.3 \). We need to find the standard error of the mean.
Step 1: Recall the formula for the standard error of the mean
The standard error (SE) of the sample mean is given by:
\( SE = \frac{s}{\sqrt{n}} \)
where \( s \) is the sample standard deviation and \( n \) is the sample size.
Step 2: Plug in the values
Here, \( s = 9.3 \) and \( n = 27 \).
First, calculate \( \sqrt{n} \):
\( \sqrt{27} \approx 5.196 \)
Step 3: Compute the standard error
Now, divide \( s \) by \( \sqrt{n} \):
\( SE = \frac{9.3}{\sqrt{27}} \approx \frac{9.3}{5.196} \approx 1.79 \)
Interpretation
The standard error of the mean is approximately \( 1.79 \). This tells us how much the sample mean (114.9) is likely to vary from the true population mean of blood pressure, due to sampling variability. In other words, if we took many samples of 27 adults and calculated their mean blood pressure, the standard deviation of these sample means would be about 1.79.
Final Answer (for Problem 7)
The standard error of the mean is \( \boldsymbol{\frac{9.3}{\sqrt{27}} \approx 1.79} \).
---
Problem 8: Travel time to work
We have a sample of \( n = 20 \) adults, sample mean \( \bar{x} = 31.25 \) minutes, and sample standard deviation \( s_x = 21.588 \) minutes. We need to find the standard error of the mean.
Step 1: Use the same formula for standard error
\( SE = \frac{s}{\sqrt{n}} \)
Step 2: Plug in the values
Here, \( s = 21.588 \) and \( n = 20 \).
First, calculate \( \sqrt{n} \):
\( \sqrt{20} \approx 4.472 \)
Step 3: Compute the standard error
\( SE = \frac{21.588}{\sqrt{20}} \approx \frac{21.588}{4.472} \approx 4.83 \)
Interpretation
The standard error of the mean is approximately \( 4.83 \) minutes. This means that if we took many samples of 20 commuters and calculated their mean travel time, the standard deviation of these sample means would be about 4.83 minutes.
Final Answer (for Problem 8)
The standard error of the mean is \( \boldsymbol{\frac{21.588}{\sqrt{20}} \approx 4.83} \) minutes.
---
Problem 9(a): Confidence interval for bone mineral change
We have a sample of \( n = 47 \) breastfeeding mothers, sample mean \( \bar{x} = -3.587\% \), sample standard deviation \( s = 2.5063\% \). We need to construct a 99% confidence interval for the population mean.
Step 1: Recall the formula for a confidence interval for the mean (t-interval, since \( \sigma \) is unknown)
The formula is:
\( \bar{x} \pm t^* \cdot \frac{s}{\sqrt{n}} \)
where \( t^* \) is the critical value from the t-distribution with \( df = n - 1 \), \( \bar{x} \) is the sample mean, \( s \) is the sample standard deviation, and \( n \) is the sample size.
Step 2: Find the critical value \( t^* \)
For a 99% confidence interval and \( df = 47 - 1 = 46 \), we use a t-table or calculator. Using a t-table or technology, \( t^* \approx 2.687 \) (for 99% confidence and \( df = 46 \)).
Step 3: Calculate the margin of error (ME)
\( ME = t^* \cdot \frac{s}{\sqrt{n}} \)
Plug in the values:
\( \frac{s}{\sqrt{n}} = \frac{2.5063}{\sqrt{47}} \approx \frac{2.5063}{6.8557} \approx 0.3656 \)
Then, \( ME = 2.687 \cdot 0.3656 \approx 0.982 \)
Step 4: Construct the confidence interval
Lower bound: \( \bar{x} - ME = -3.587 - 0.982 = -4.569 \)
Upper bound: \( \bar{x} + ME = -3.587 + 0.982 = -2.605 \)
Interpretation
We are 99% confident that the true mean percent change in bone mineral content (BMC) for all breastfeeding mothers is between \( -4.57\% \) and \( -2.61\% \) (rounded to two decimal places). This means that if we were to take many samples of 47 breastfeeding mothers, 99% of the confidence intervals constructed would contain the true population mean change in BMC.
Final Answer (for Problem 9(a))
The 99% confidence interval is \( \boldsymbol{(-4.57\%, -2.61\%)} \) (or more precisely \( (-4.569\%, -2.605\%) \)). We are 99% confident the true mean percent change in BMC for breastfeeding mothers is in this interval.
---
Problem 9(b): Convincing evidence mothers lose bone mineral?
From part (a), the 99% confidence interval is \( (-4.57\%, -2.61\%) \). All values in this interval are negative, meaning the mean change in BMC is negative (i.e., mothers lose bone mineral, on average). Since zero (no change) is not in the interval, this provides convincing evidence that breastfeeding mothers lose bone mineral, on average.
Final Answer (for Problem 9(b))
Yes, the data give convincing evidence. The 99% confidence interval for the mean percent change in BMC is entirely negative (e.g., \( -4.57\% \) to \( -2.61\% \)), so we are 99% confident the true mean change is negative. This means mothers lose bone mineral, on average.
---
Problem 10(a): Confidence interval for reading scores
We have a sample of \( n = 240 \) eighth-graders, sample mean \( \bar{x} = 42.17 \), sample standard deviation \( s = 42.17 \)? Wait, no—wait, the problem says: "a random sample of 240 eighth-graders in Atlanta had a mean of 42.17 and standard deviation of 42.17?" Wait, no, let's check:
Wait, the problem: "A random sample of 240 eighth-graders in Atlanta had a mean of 42.17 and standard deviation of 42.17?" Wait, no, the original problem: "A random sample of 240 eighth - graders in Atlanta had a mean of 42.17 and standard deviation of 42.17?" Wait, no, let's re-read:
"Reading scores in Atlanta... A random sample of 240 eighth - graders in Atlanta had a mean of 42.17 and standard deviation of 42.17?" Wait, no, the user's image: "a random sample of 240 with mean of 42.17 and standard deviation of 42.17?" Wait, no, probably a typo, but assuming \( \bar{x} = 42.17 \), \( s = 42.17 \), \( n = 240 \). We need a 99% confidence interval for the population mean.
Step 1: Formula (t-interval, but \( n \) is large, so t is close to z)
\( \bar{x} \pm t^* \cdot \frac{s}{\sqrt{n}} \)
For \( n = 240 \), \( df = 239 \), so \( t^* \approx z^* = 2.576 \) (since \( n \) is large, t-distribution approximates z-distribution).
Step 2: Calculate the standard error
\( \frac{s}{\sqrt{n}} = \frac{42.17}{\sqrt{240}} \approx \frac{42.17}{15.4919} \approx 2.722 \)
Step 3: Margin of error (ME)
\( ME = 2.576 \cdot 2.722 \approx 7.01 \)
Step 4: Confidence interval
Lower bound: \( 42.17 - 7.01 = 35.16 \)
Upper bound: \( 42.17 + 7.01 = 49.18 \)
Interpretation
We are 99% confident that the true mean reading test score for all Atlanta eighth-graders is between 35.16 and 49.18.
Final Answer (for Problem 10(a))
The 99% confidence interval is \( \boldsymbol{(35.16, 49.18)} \) (or more precisely, using \( t^* \) for \( df = 239 \), but with large \( n \), it’s approximately this). We are 99% confident the true mean reading score is in this interval.
Let me know if you need help with other problems!