QUESTION IMAGE
Question
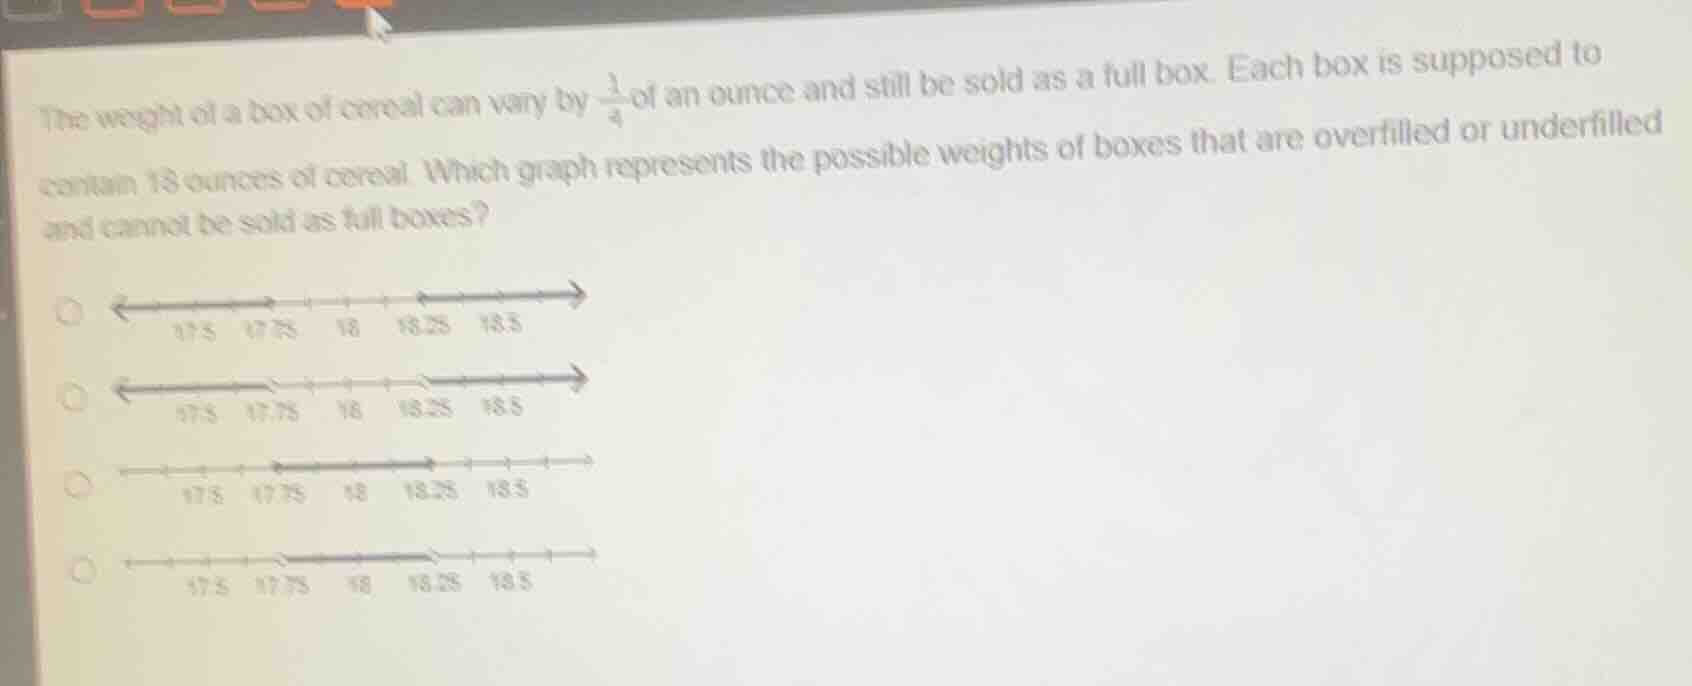
the weight of a box of cereal can vary by \\(\frac{1}{4}\\) of an ounce and still be sold as a full box. each box is supposed to contain 18 ounces of cereal. which graph represents the possible weights of boxes that are overfilled or underfilled and cannot be sold as full boxes? \\(\circ\\) graph 1: number line with 17.5, 17.75, 18, 18.25, 18.5, left arrow and right arrow at ends \\(\circ\\) graph 2: number line with 17.5, 17.75, 18, 18.25, 18.5, open circles and arrows \\(\circ\\) graph 3: number line with 17.5, 17.75, 18, 18.25, 18.5, closed arrows in middle \\(\circ\\) graph 4: number line with 17.5, 17.75, 18, 18.25, 18.5, open circles and middle arrow
Step1: Find acceptable weight range
First, calculate the minimum and maximum acceptable weights. The target weight is 18 ounces, with a variation of $\frac{1}{4}=0.25$ ounces.
Minimum acceptable weight: $18 - 0.25 = 17.75$ ounces
Maximum acceptable weight: $18 + 0.25 = 18.25$ ounces
Step2: Identify rejected weights
Rejected (over/underfilled) weights are those less than 17.75 ounces or greater than 18.25 ounces. On a number line, this means:
- An arrow pointing left from an open circle at 17.75 (since 17.75 is still acceptable, so it's not included in rejected weights)
- An arrow pointing right from an open circle at 18.25 (since 18.25 is still acceptable, so it's not included in rejected weights)

Snap & solve any problem in the app
Get step-by-step solutions on Sovi AI
Photo-based solutions with guided steps
Explore more problems and detailed explanations
The second graph (with open circles at 17.75 and 18.25, and shaded regions extending left from 17.75 and right from 18.25)