QUESTION IMAGE
Question
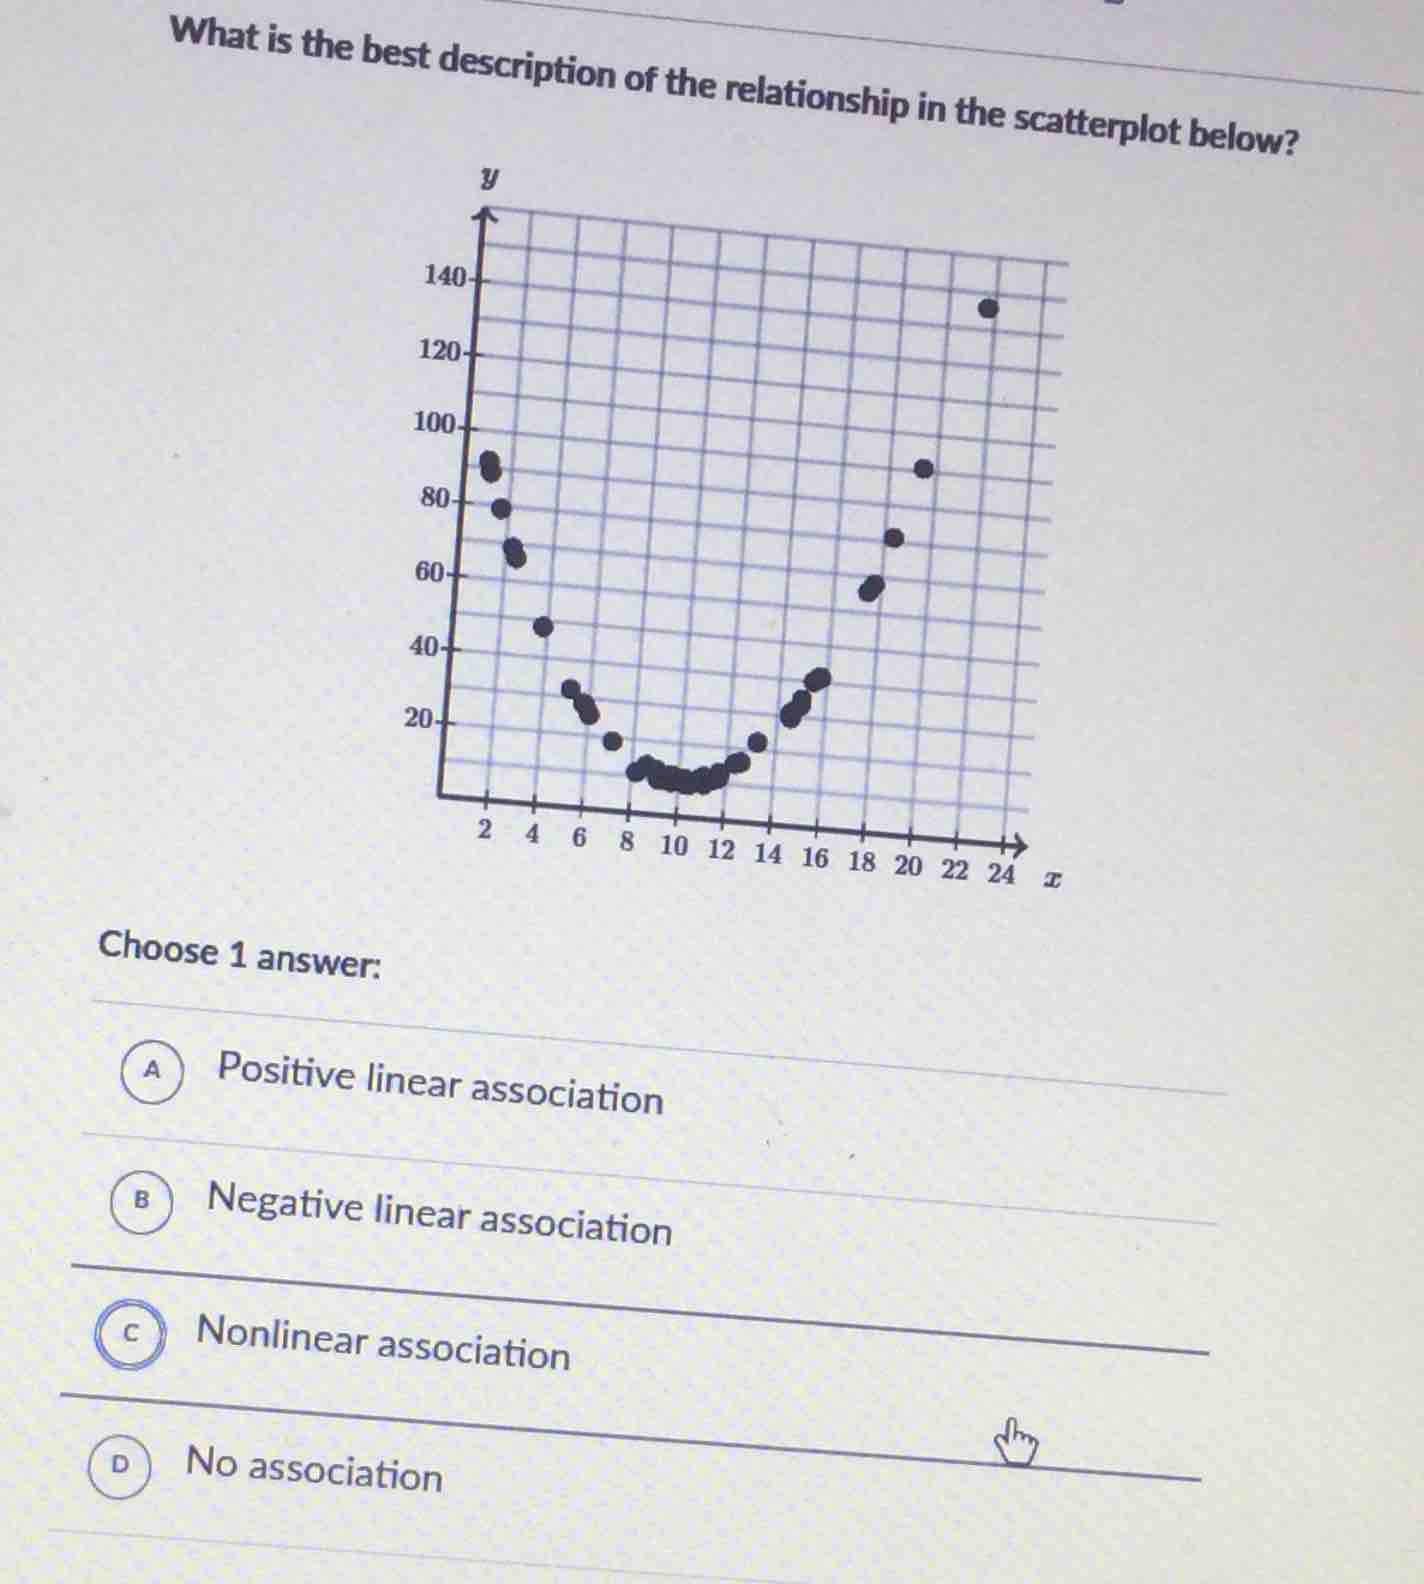
what is the best description of the relationship in the scatterplot below?
choose 1 answer:
a positive linear association
b negative linear association
c nonlinear association
d no association
Brief Explanations
To determine the relationship in the scatterplot, we analyze the pattern of the points:
- A positive linear association (A) would have points increasing in a straight - line trend. But here, the points first decrease, then increase, so not linear.
- A negative linear association (B) would have points decreasing in a straight - line trend. The points in this scatterplot do not show a consistent decrease.
- A nonlinear association (C) occurs when the points follow a curved pattern. Here, the points seem to form a U - shaped curve (first decreasing, then increasing), which is a nonlinear pattern.
- No association (D) would have points scattered randomly with no discernible pattern. But here, there is a clear curved pattern.

Snap & solve any problem in the app
Get step-by-step solutions on Sovi AI
Photo-based solutions with guided steps
Explore more problems and detailed explanations
C. Nonlinear association