QUESTION IMAGE
Question
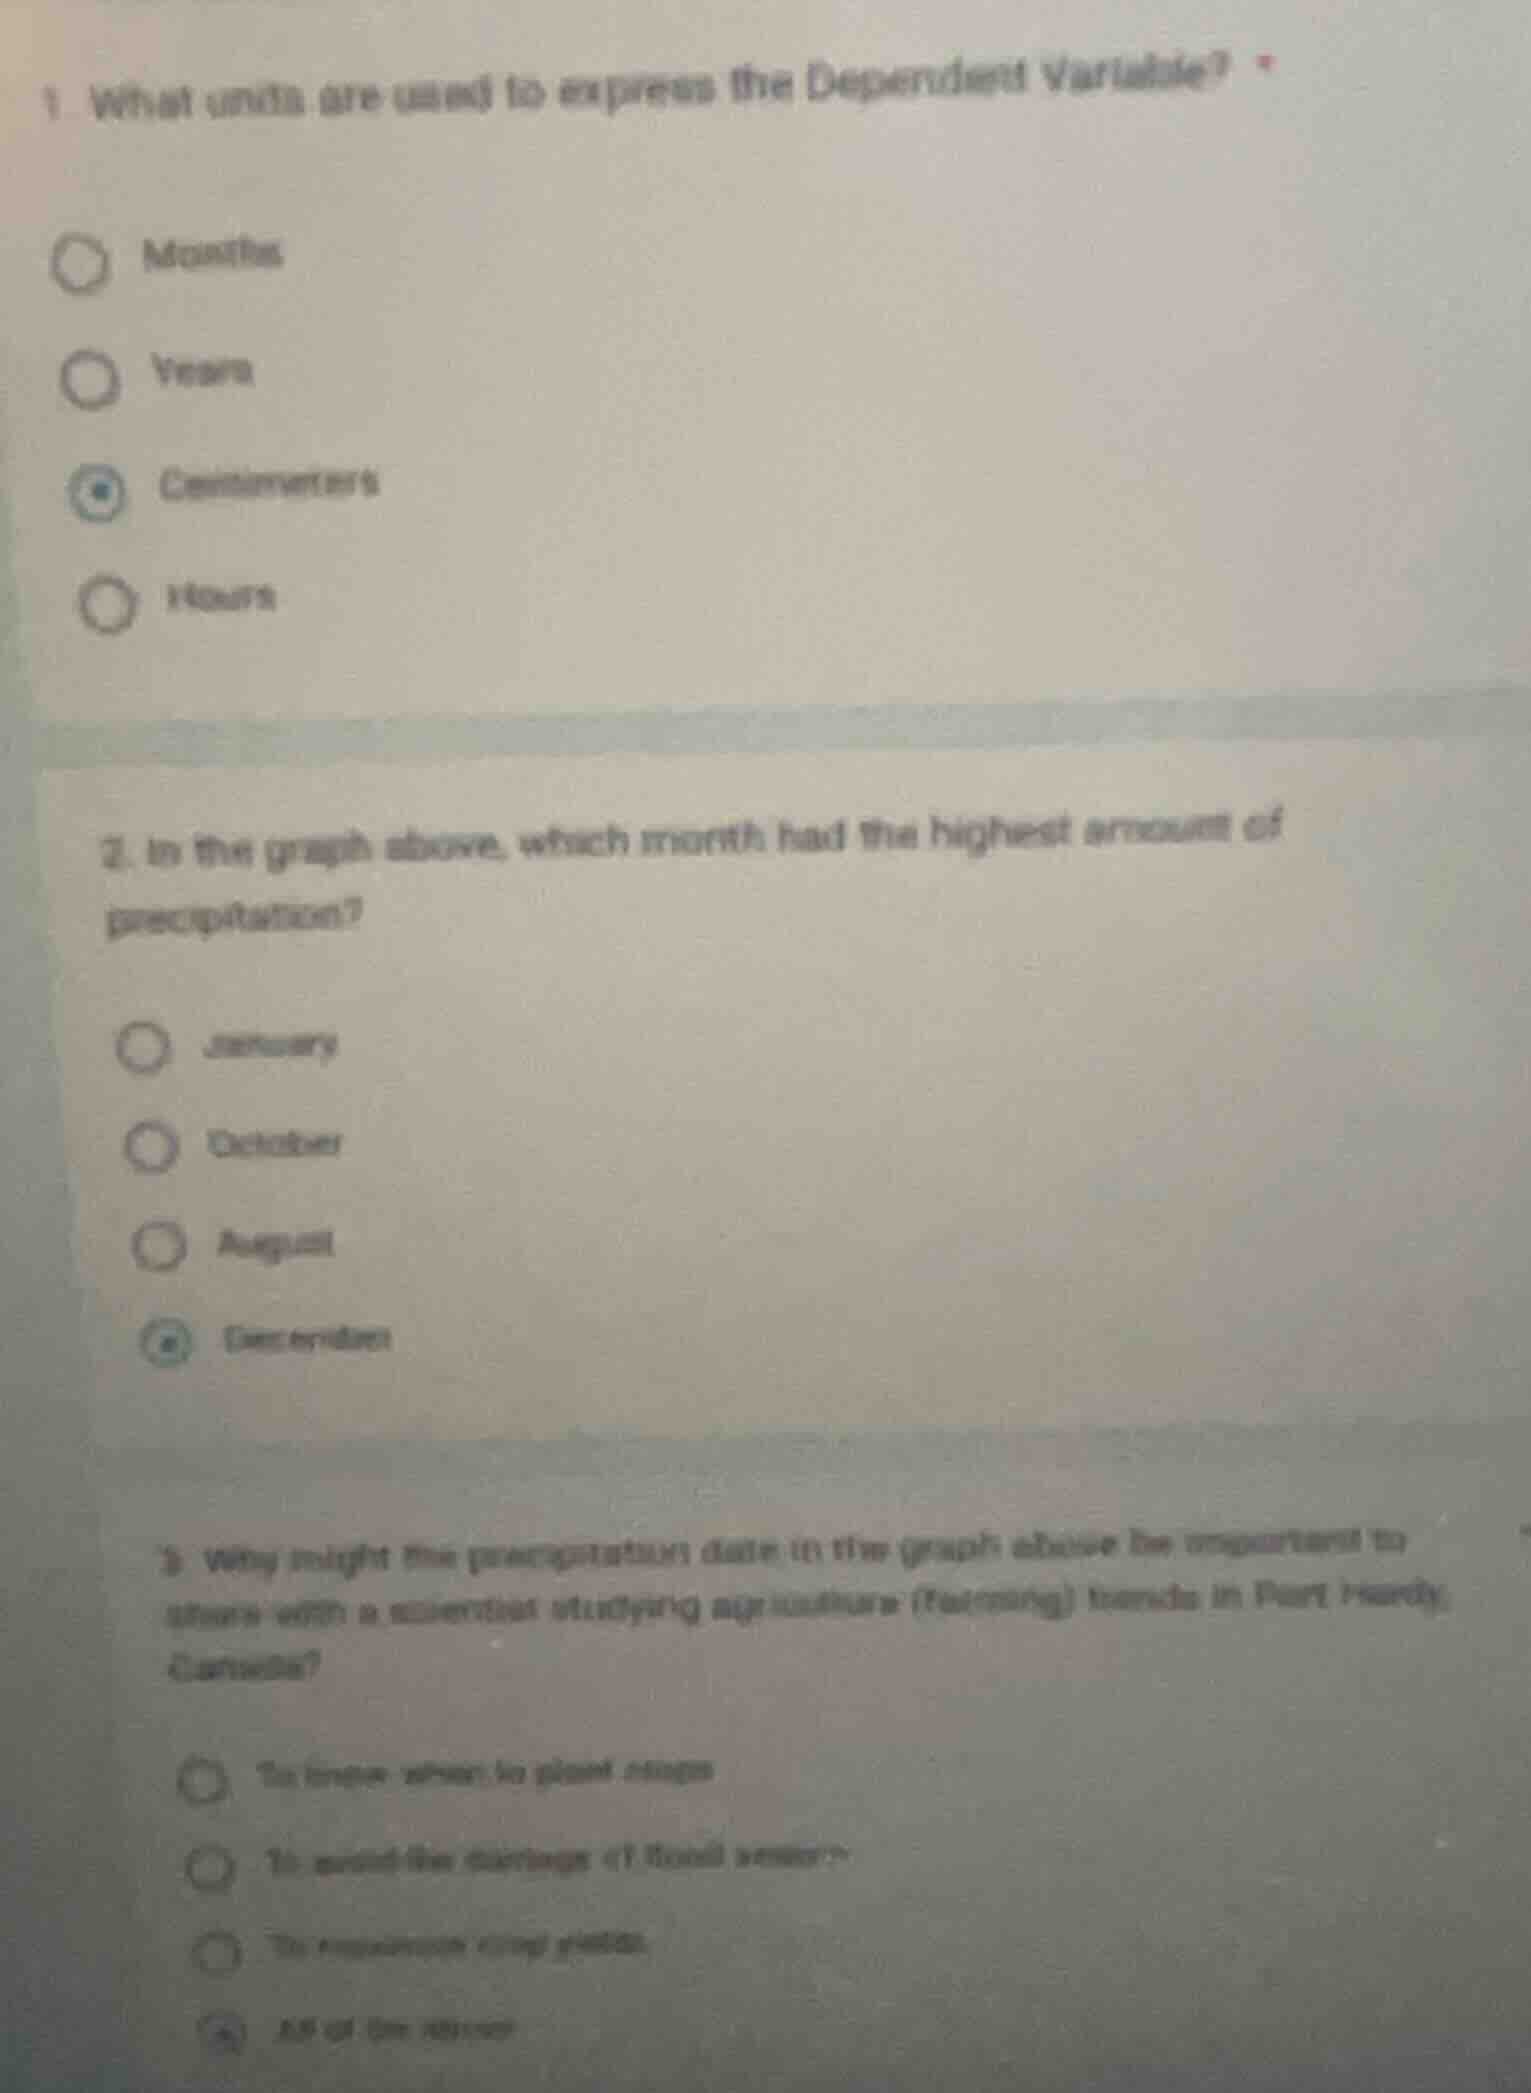
1 what units are used to express the dependent variable?
months
years
centimeters
hours
- in the graph above, which month had the highest amount of precipitation?
january
october
august
december
- why might the precipitation date in the graph above be important to share with a scientist studying agriculture (farming) trends in port hardy, canada?
to know when to plant crops
to avoid the shortage of food memory
to encourage crop yields.
all of the above
Question 1
The dependent variable here is likely precipitation (implied by the context of the following questions about precipitation). Precipitation is often measured in centimeters (a unit of length for measuring the depth of water). Months, years, and hours are time units, not for measuring precipitation amount.
The question asks which month had the highest precipitation. From the options, December is selected (as per the marked option in the image), likely because in the associated graph (not fully shown but inferred from the selection), December had the highest precipitation amount among January, October, August, and December.
For a scientist studying agriculture in Port Hardy, Canada, precipitation data helps: knowing when to plant crops (since planting timing depends on water availability), avoiding food shortages (by planning crop cycles based on precipitation to ensure yields), and improving crop yields (by managing irrigation or choosing crops suited to precipitation patterns). So all options are valid.

Snap & solve any problem in the app
Get step-by-step solutions on Sovi AI
Photo-based solutions with guided steps
Explore more problems and detailed explanations
C. Centimeters