QUESTION IMAGE
Question
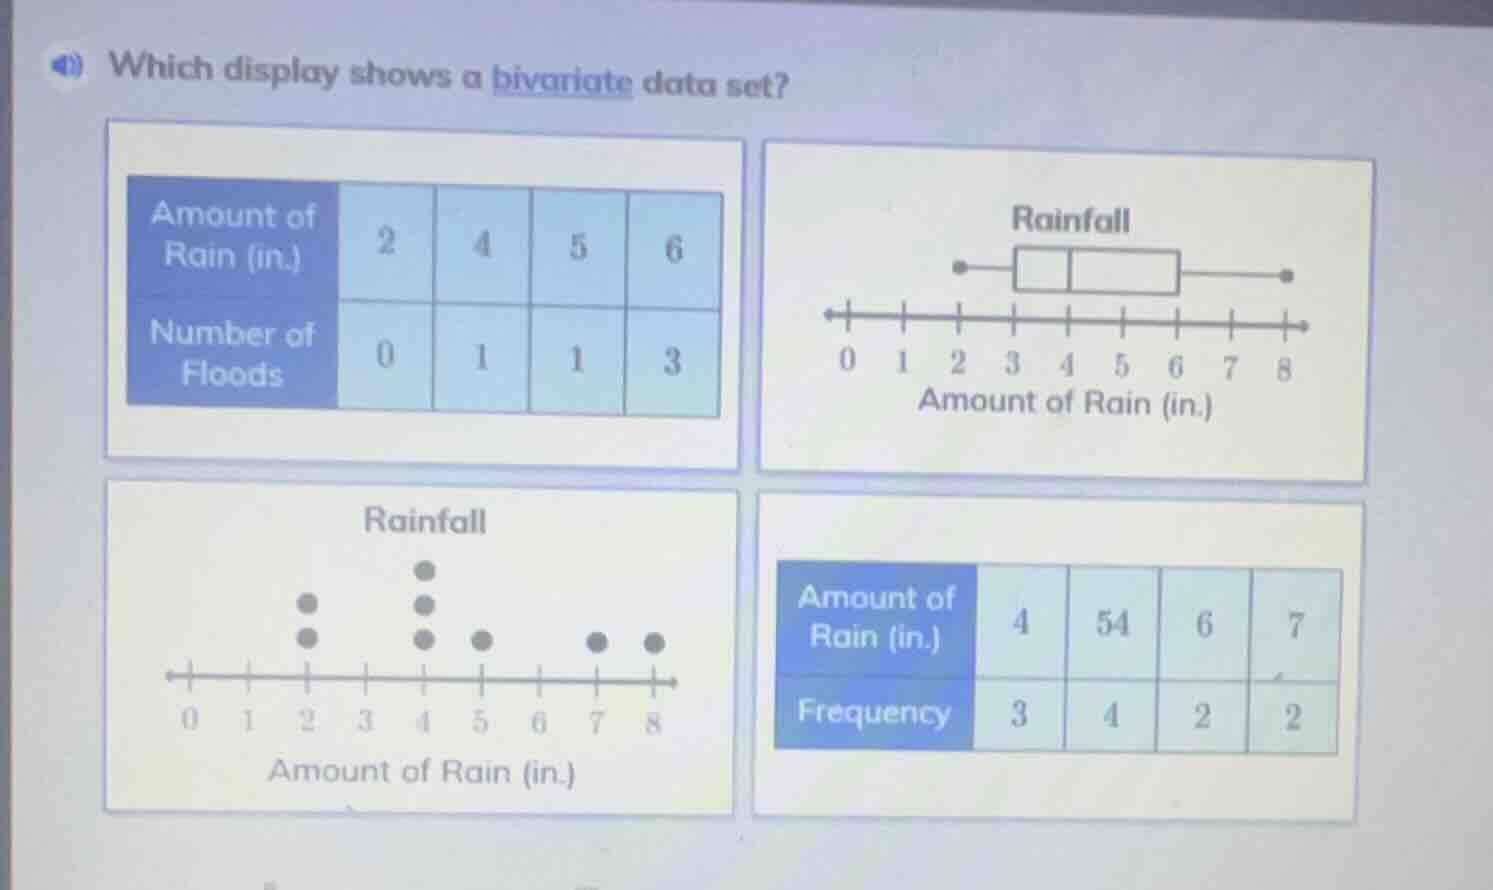
which display shows a bivariate data set?
Brief Explanations
Bivariate data links two related variables. The top-left table pairs "Amount of Rain (in.)" with "Number of Floods", tracking two variables for each data point. The box plot, dot plot, and bottom-right table only represent a single variable (rainfall or its frequency) without a paired second variable.

Snap & solve any problem in the app
Get step-by-step solutions on Sovi AI
Photo-based solutions with guided steps
Explore more problems and detailed explanations
Top-left table:
| Amount of Rain (in.) | 2 | 4 | 5 | 6 |
|---|