QUESTION IMAGE
Question
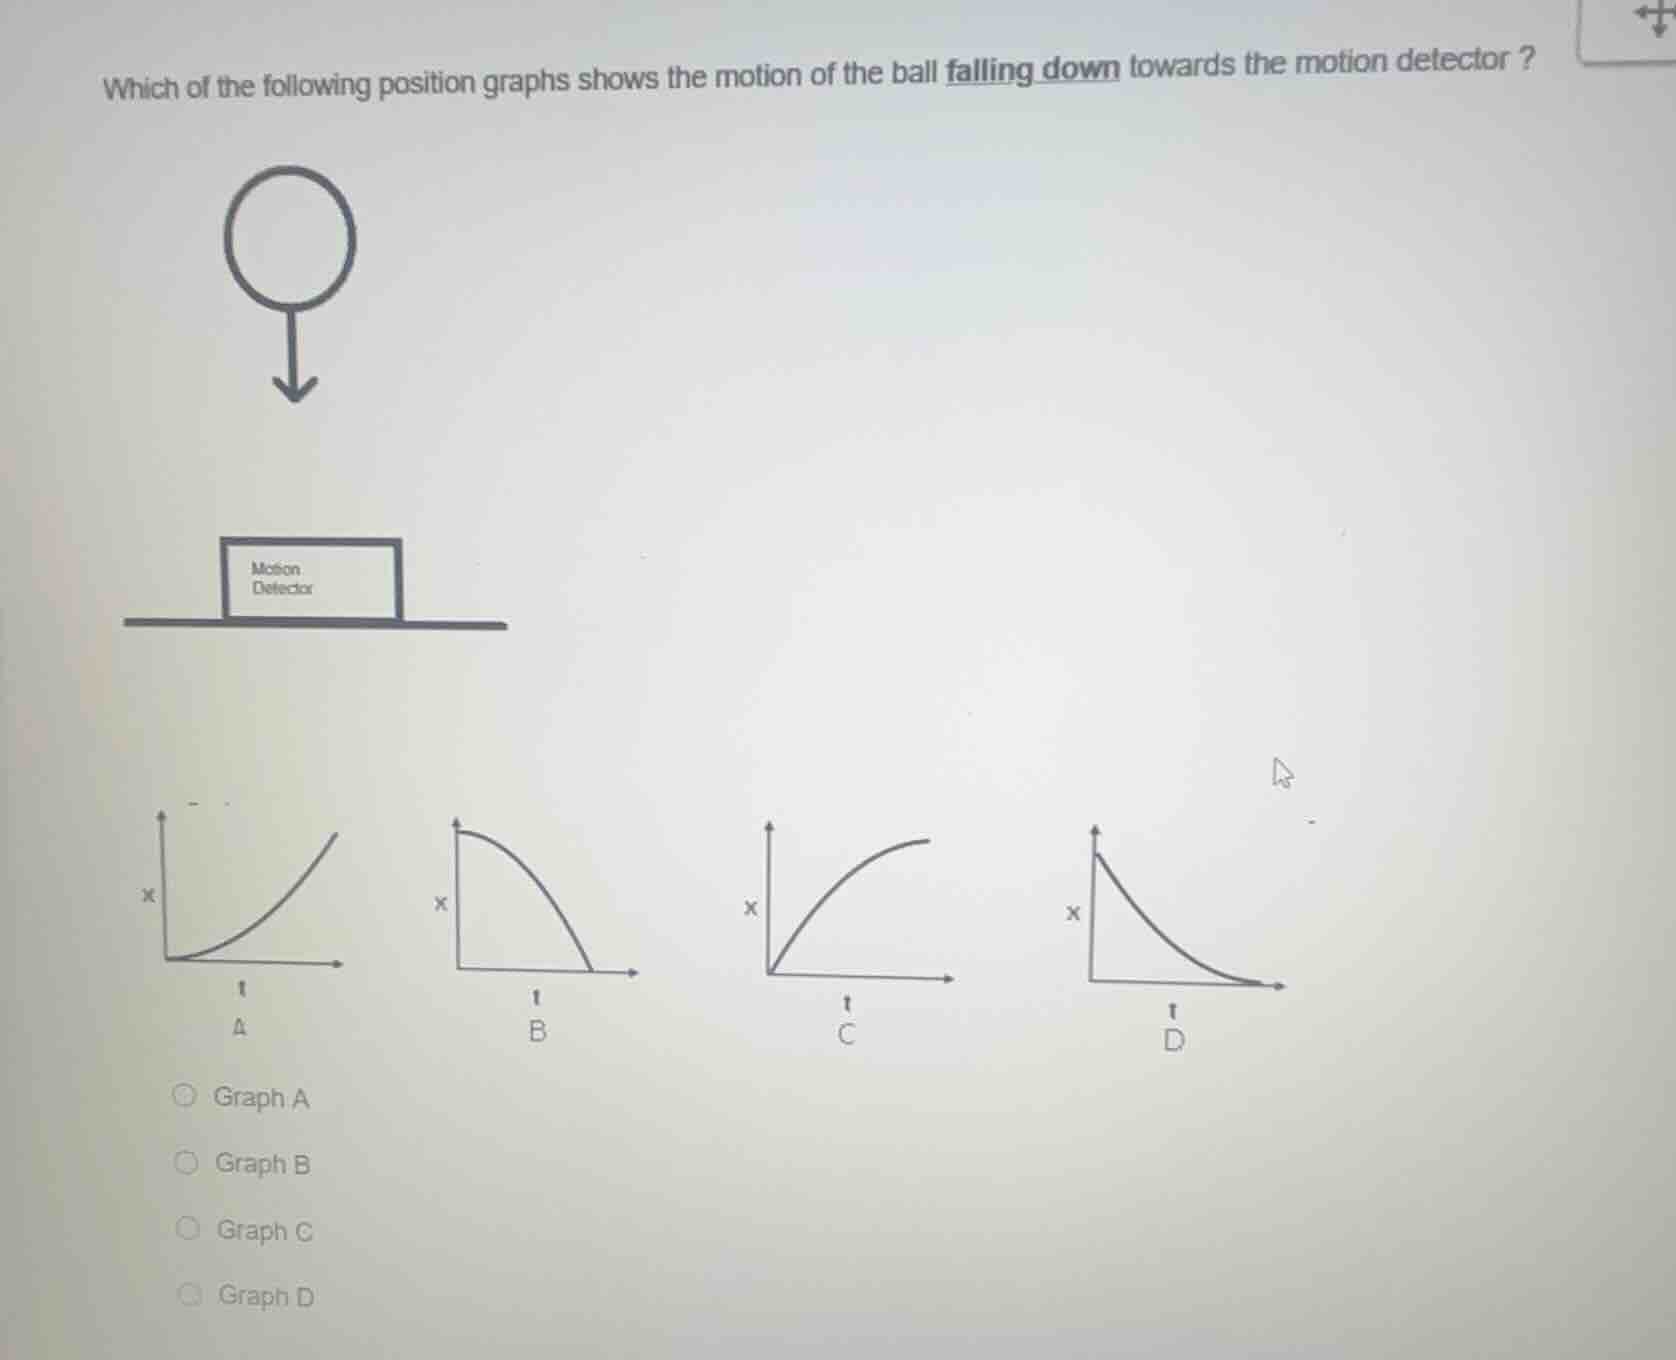
which of the following position graphs shows the motion of the ball falling down towards the motion detector ?
motion detector
graph a
graph b
graph c
graph d
Brief Explanations
When a ball falls down towards a motion detector, the distance (position, \( x \)) between the ball and the detector decreases over time (\( t \)). Also, the ball is accelerating due to gravity, so the rate of decrease of \( x \) (the slope of the \( x - t \) graph) should increase (become more negative, or steeper in the downward direction).
- Graph A: \( x \) increases with \( t \), and the slope increases (speeding up away), not towards the detector. Eliminate.
- Graph B: \( x \) decreases with \( t \), but the slope becomes less steep (decelerating), which contradicts gravitational acceleration. Eliminate.
- Graph C: \( x \) increases with \( t \), moving away. Eliminate.
- Graph D: \( x \) decreases with \( t \) (towards the detector), and the slope becomes steeper (speeding up, consistent with acceleration due to gravity). This matches the motion.

Snap & solve any problem in the app
Get step-by-step solutions on Sovi AI
Photo-based solutions with guided steps
Explore more problems and detailed explanations
Graph D