QUESTION IMAGE
Question
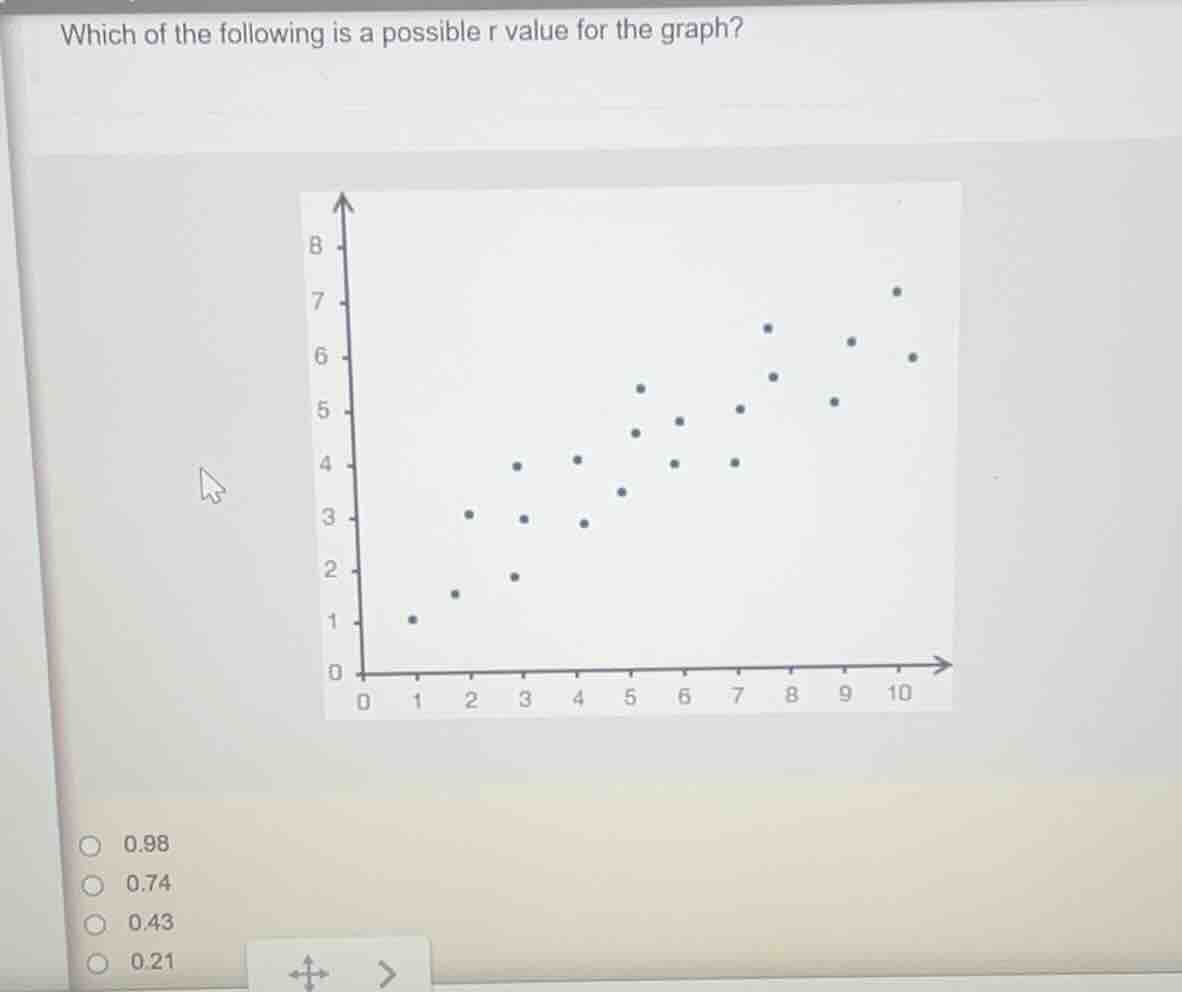
which of the following is a possible r value for the graph?
0.98
0.74
0.43
0.21
Step1: Interpret scatter plot trend
The scatter plot shows a strong positive linear trend: as the x-value increases, the y-value consistently increases, and points are clustered closely around an imaginary positive-slope line.
Step2: Match trend to r-value
The correlation coefficient $r$ ranges from -1 to 1. A strong positive trend corresponds to an $r$-value close to 1. Among the options, 0.98 is closest to 1, while 0.74, 0.43, and 0.21 represent weaker positive correlations that do not match the tight clustering of points.

Snap & solve any problem in the app
Get step-by-step solutions on Sovi AI
Photo-based solutions with guided steps
Explore more problems and detailed explanations
0.98