QUESTION IMAGE
Question
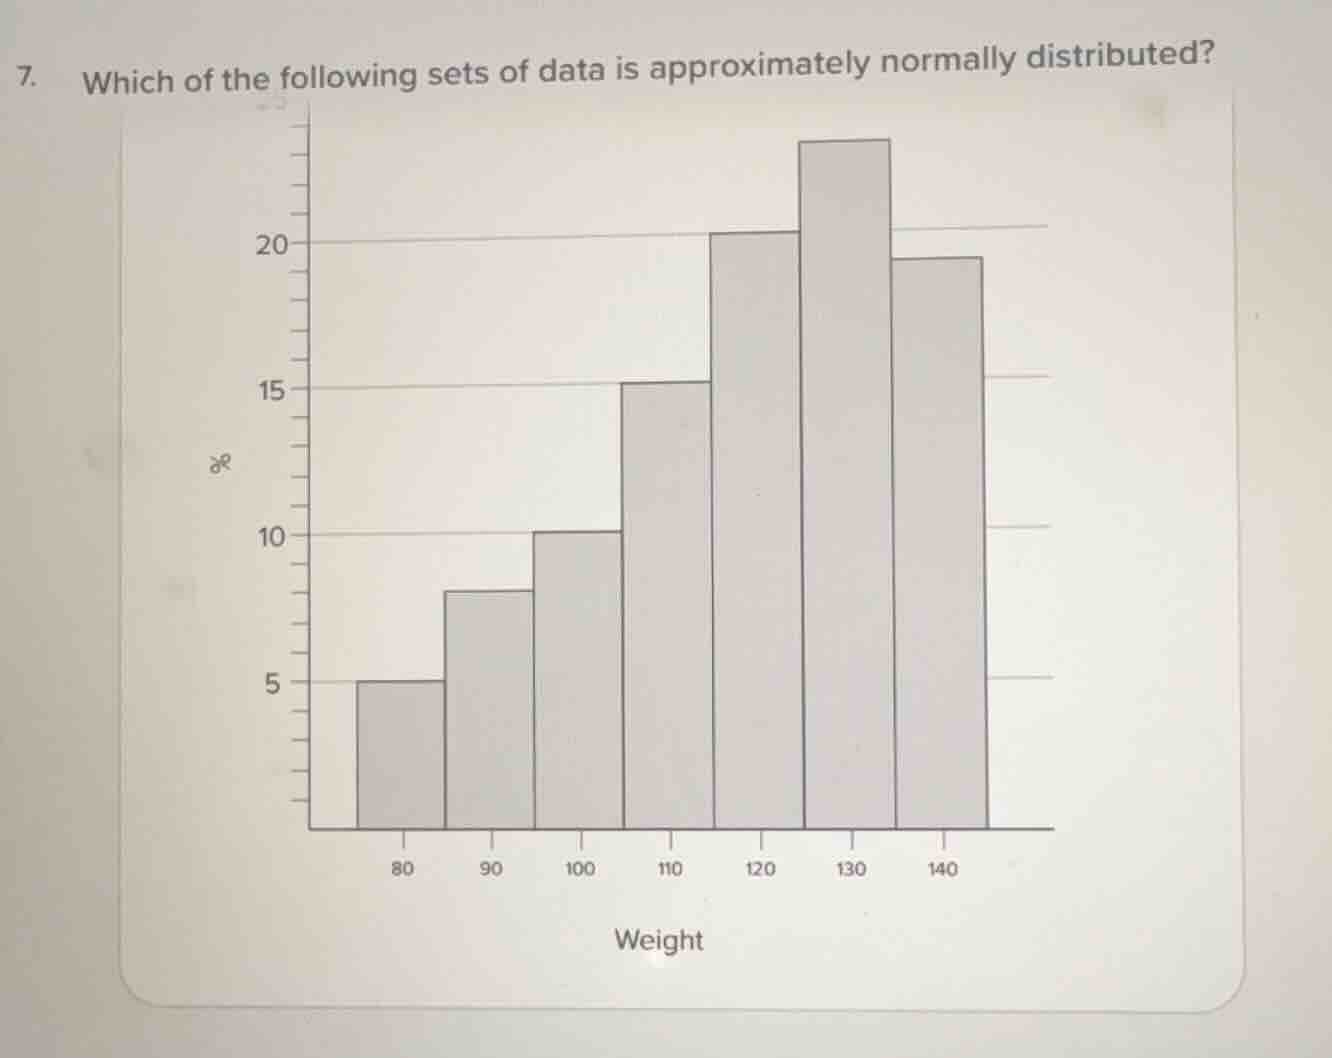
- which of the following sets of data is approximately normally distributed? (chart: x - axis weight (80,90,100,110,120,130,140), y - axis % (5,10,15,20), bars with heights around 5, ~8, 10, 15, 20, ~23, ~19)
Step1: Recall Normal Distribution Shape
A normal distribution (bell - shaped curve) has the following characteristics: it is symmetric about the mean, the frequency increases gradually to a peak (the mean, median, and mode are approximately equal) and then decreases gradually.
Step2: Analyze the Given Histogram
Looking at the histogram of weight:
- The frequencies start from a low value (around 5% for weight 80), then increase as the weight increases, reaching a peak (the tallest bar) at weight 130, and then decrease (the bar for weight 140 is shorter than the peak bar). Also, if we were to imagine the symmetry, although it's a histogram (discrete representation), the general trend of increasing to a peak and then decreasing is in line with the shape of a normal distribution. Other common non - normal distributions like uniform (all bars same height), skewed left (tail on left) or skewed right (tail on right) don't match here. The given histogram shows a roughly symmetric (or at least a single - peaked, gradually increasing then decreasing) pattern which is characteristic of a normal distribution.

Snap & solve any problem in the app
Get step-by-step solutions on Sovi AI
Photo-based solutions with guided steps
Explore more problems and detailed explanations
The data set (weight data represented by this histogram) is approximately normally distributed.