QUESTION IMAGE
Question
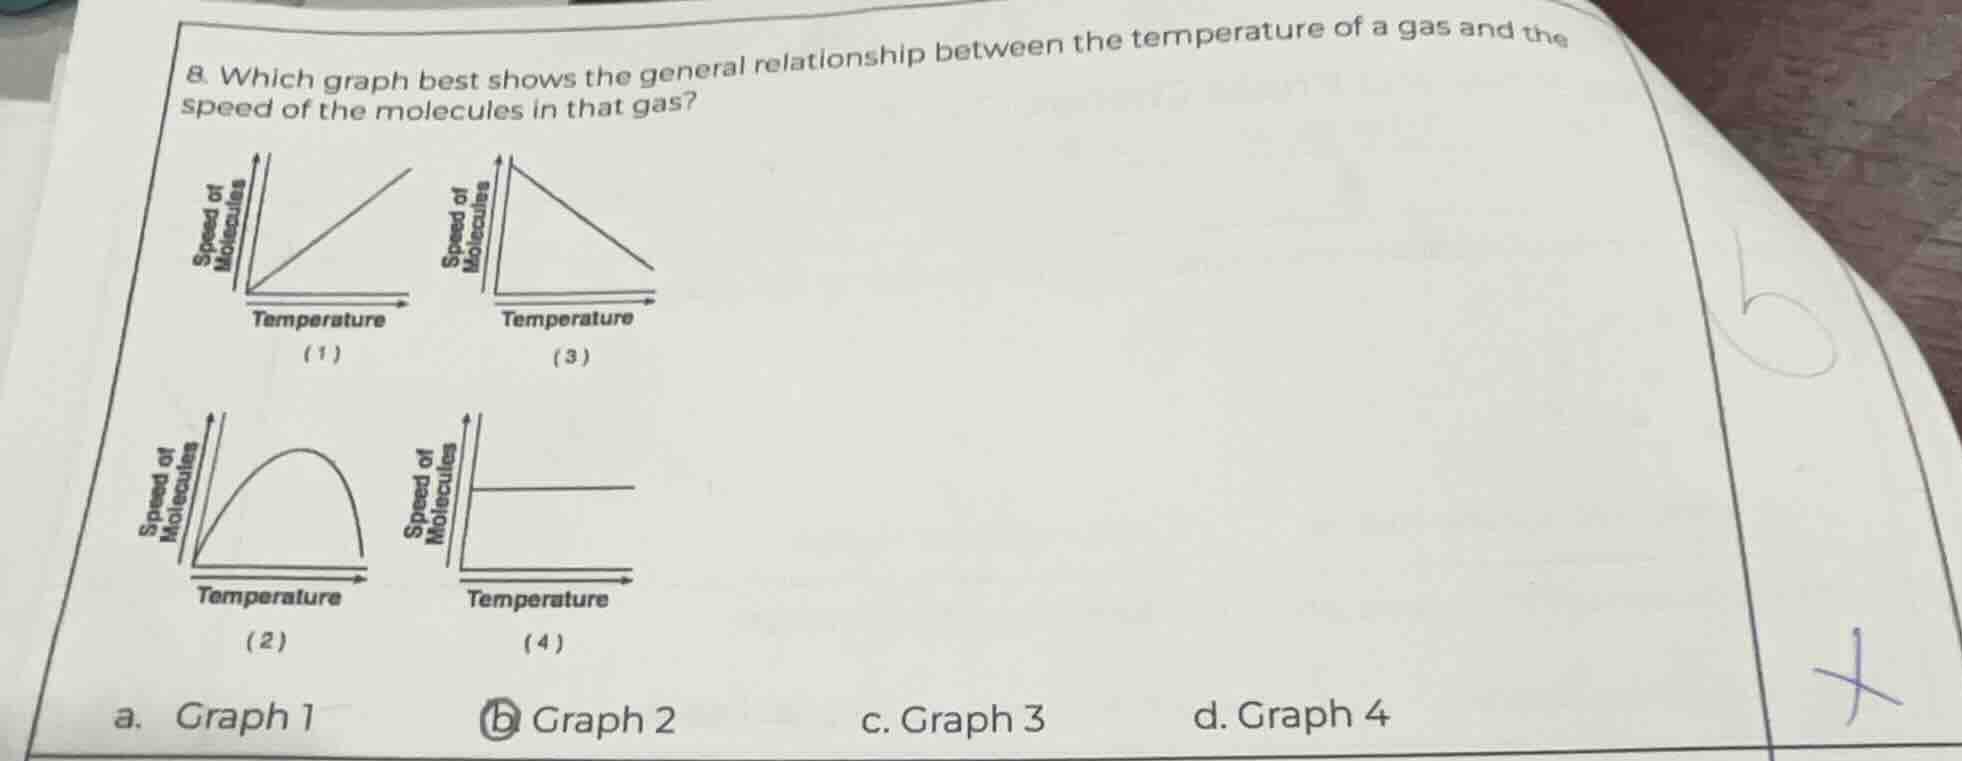
- which graph best shows the general relationship between the temperature of a gas and the speed of the molecules in that gas?
(1) graph with speed of molecules on y - axis, temperature on x - axis, line from origin increasing
(3) graph with speed of molecules on y - axis, temperature on x - axis, line from top decreasing
(2) graph with speed of molecules on y - axis, temperature on x - axis, curve from origin peaking then dropping
(4) graph with speed of molecules on y - axis, temperature on x - axis, horizontal line
a. graph 1
b. graph 2
c. graph 3
d. graph 4
Gas temperature is a measure of the average kinetic energy of its molecules. Kinetic energy is related to molecular speed by $KE = \frac{1}{2}mv^2$, so as temperature increases, the average speed of gas molecules increases in a direct, positive linear relationship. Graph 1 shows this positive proportional relationship, while the others show inverse, peaked, or no relationship which do not match the physical principle.

Snap & solve any problem in the app
Get step-by-step solutions on Sovi AI
Photo-based solutions with guided steps
Explore more problems and detailed explanations
a. Graph 1