QUESTION IMAGE
Question
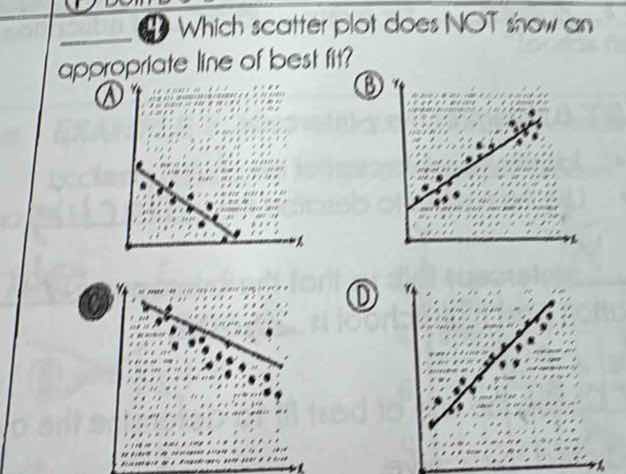
4 which scatter plot does not show an appropriate line of best fit? a b c d
Step1: Recall Line of Best Fit
A line of best fit should represent the general trend of the data points, with roughly equal numbers of points above and below the line, and the points should be reasonably close to the line (showing a strong or moderate correlation).
Step2: Analyze Each Option
- Option A: The points are close to the line, and the trend is clear (negative correlation), with points distributed around the line.
- Option B: The points follow the positive - sloped line, with a reasonable distribution around it.
- Option C: Most of the points are below the line, and the line does not seem to represent the general trend of the majority of the points. The scatter of points relative to the line is not appropriate as the line is not in the middle of the point distribution.
- Option D: The points are close to the positive - sloped line, showing a clear positive correlation with points distributed around the line.

Snap & solve any problem in the app
Get step-by-step solutions on Sovi AI
Photo-based solutions with guided steps
Explore more problems and detailed explanations
C