QUESTION IMAGE
Question
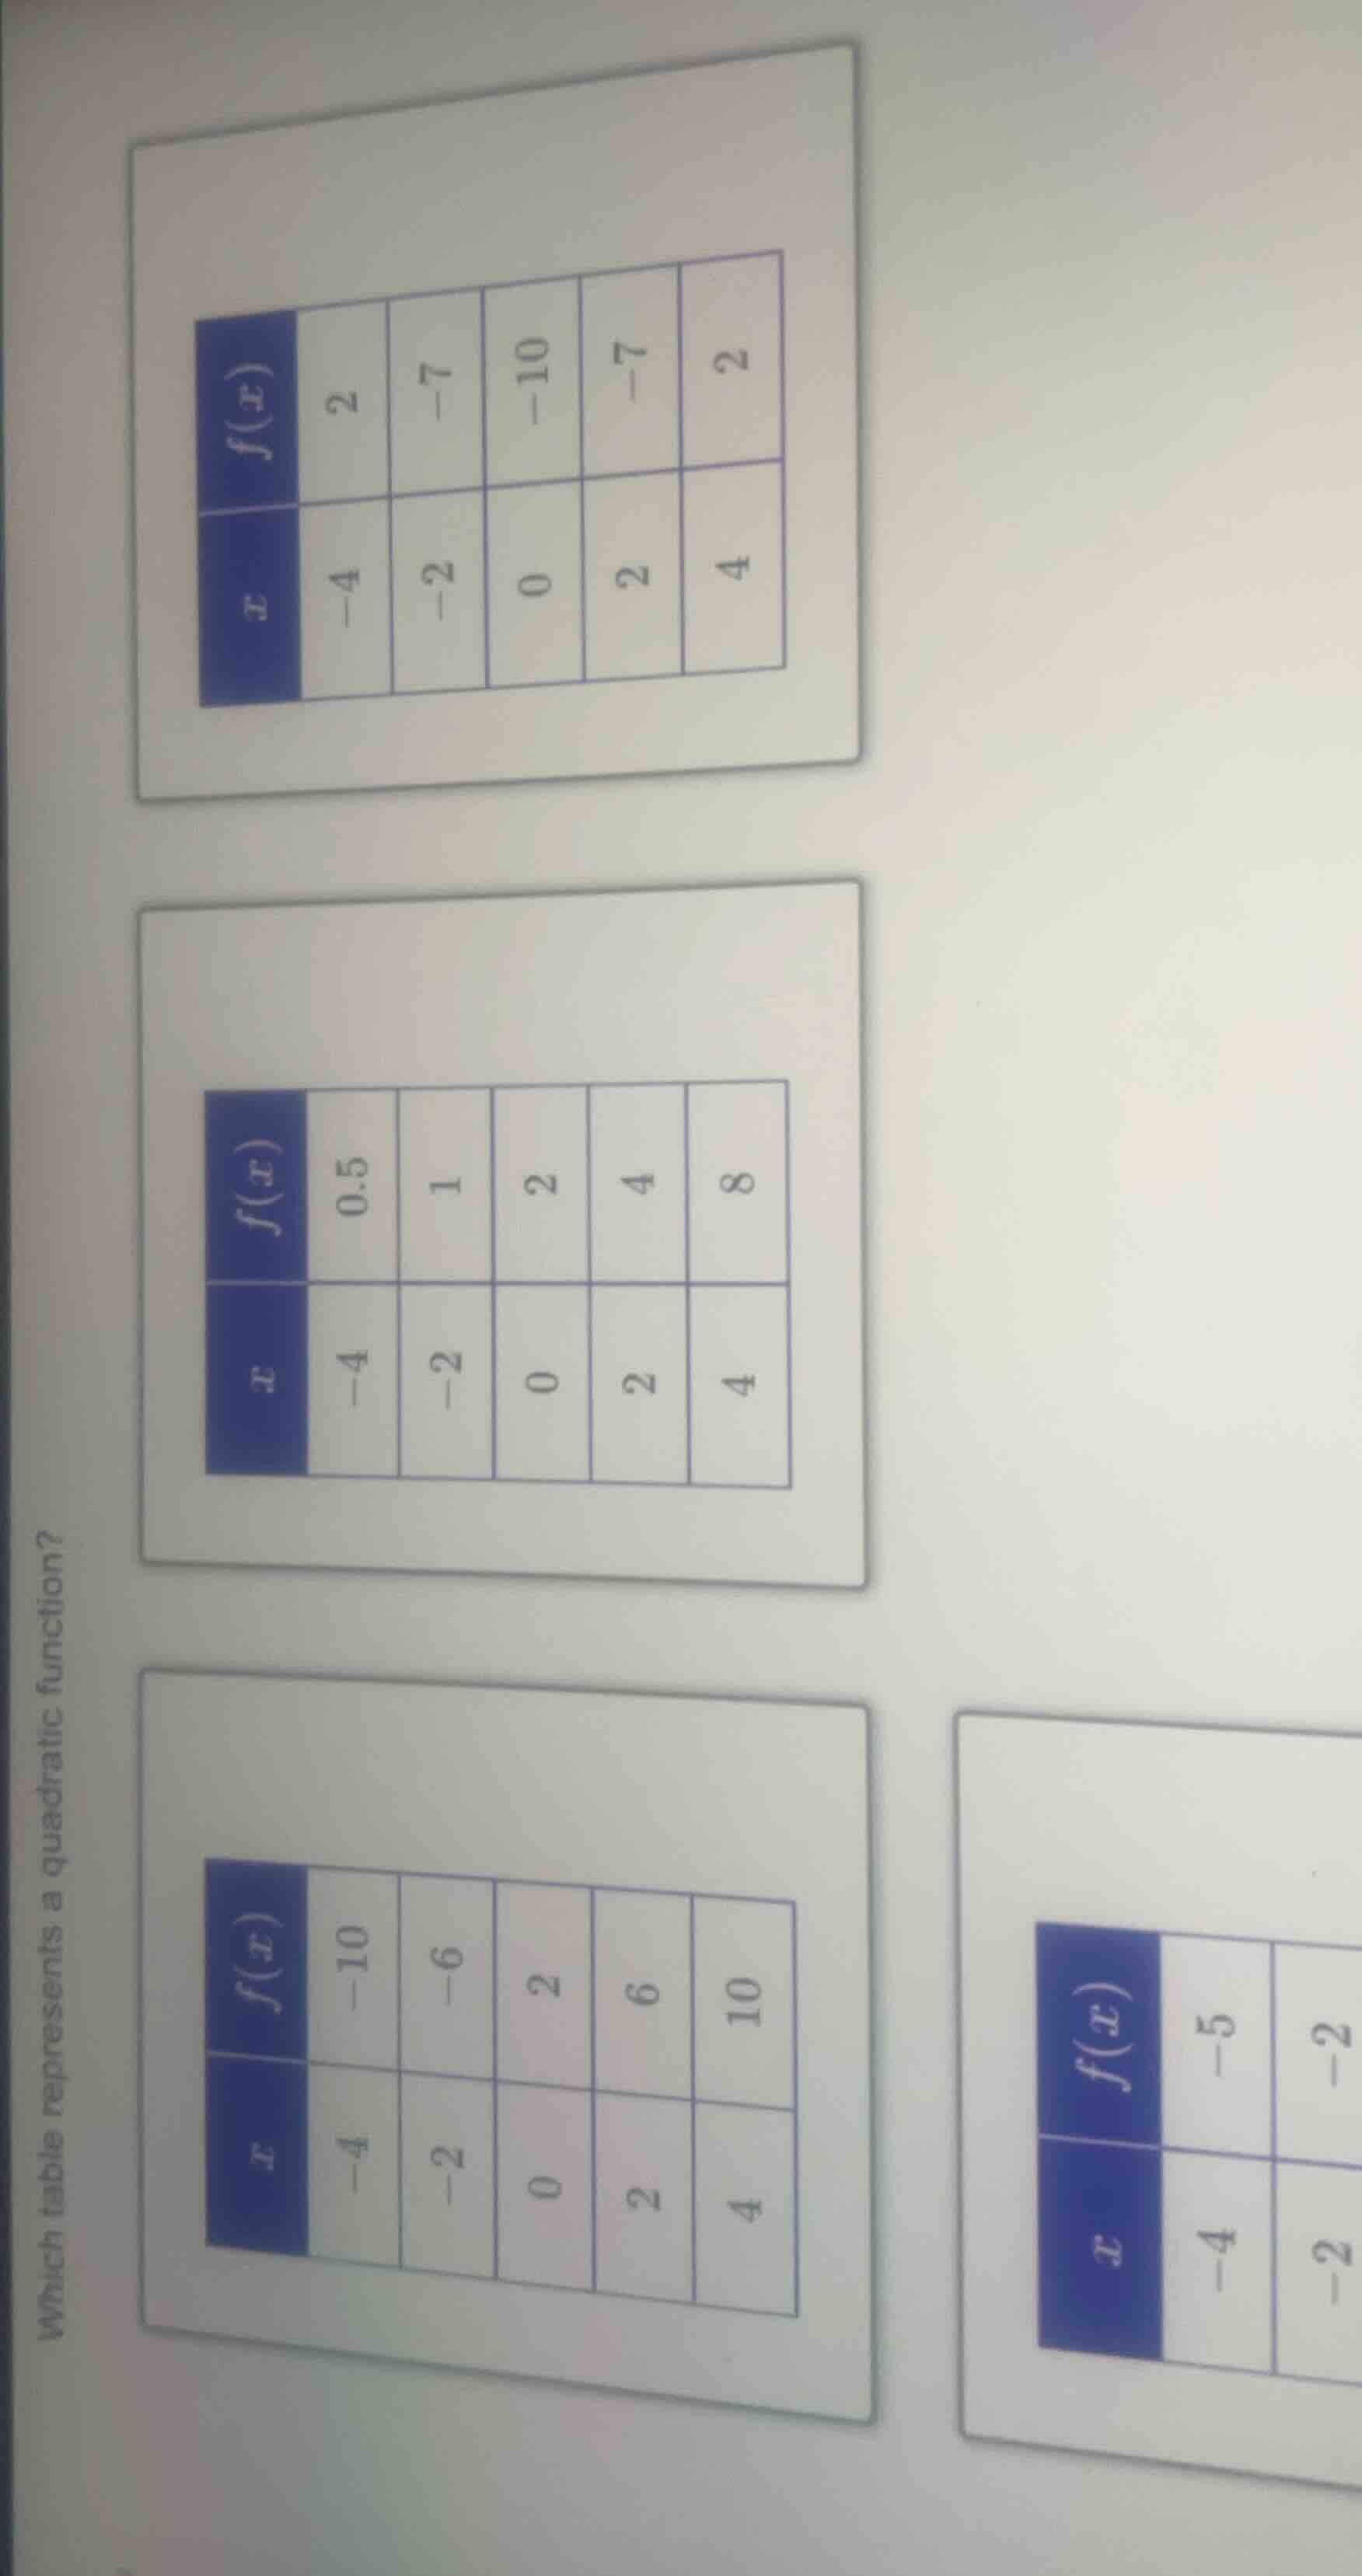
which table represents a quadratic function? \
(tables: first table: x: -4, -2, 0, 2, 4; f(x): 2, -7, -10, -7, 2; second table: x: -4, -2, 0, 2, 4; f(x): 0.5, 1, 2, 4, 8; third table: x: -4, -2, 0, 2, 4; f(x): -10, -6, 2, 6, 10; fourth table (partial): x: -4, -2; f(x): -5, -2)
Step1: Recall quadratic test rule
A quadratic function has constant second differences in its $f(x)$ values when $x$ values are equally spaced.
Step2: Analyze first table
$x$: $-4,-2,0,2,4$ (interval = 2)
First differences: $-7-2=-9$, $-10-(-7)=-3$, $-7-(-10)=3$, $2-(-7)=9$
Second differences: $-3-(-9)=6$, $3-(-3)=6$, $9-3=6$ (constant)
Step3: Analyze second table
First differences: $1-0.5=0.5$, $2-1=1$, $4-2=2$, $8-4=4$
Second differences: $1-0.5=0.5$, $2-1=1$, $4-2=2$ (not constant)
Step4: Analyze third table
First differences: $-6-(-10)=4$, $2-(-6)=8$, $6-2=4$, $10-6=4$
Second differences: $8-4=4$, $4-8=-4$, $4-4=0$ (not constant)

Snap & solve any problem in the app
Get step-by-step solutions on Sovi AI
Photo-based solutions with guided steps
Explore more problems and detailed explanations
The top table (with $f(x)$ values: 2, -7, -10, -7, 2 for $x=-4,-2,0,2,4$) represents a quadratic function.