QUESTION IMAGE
Question
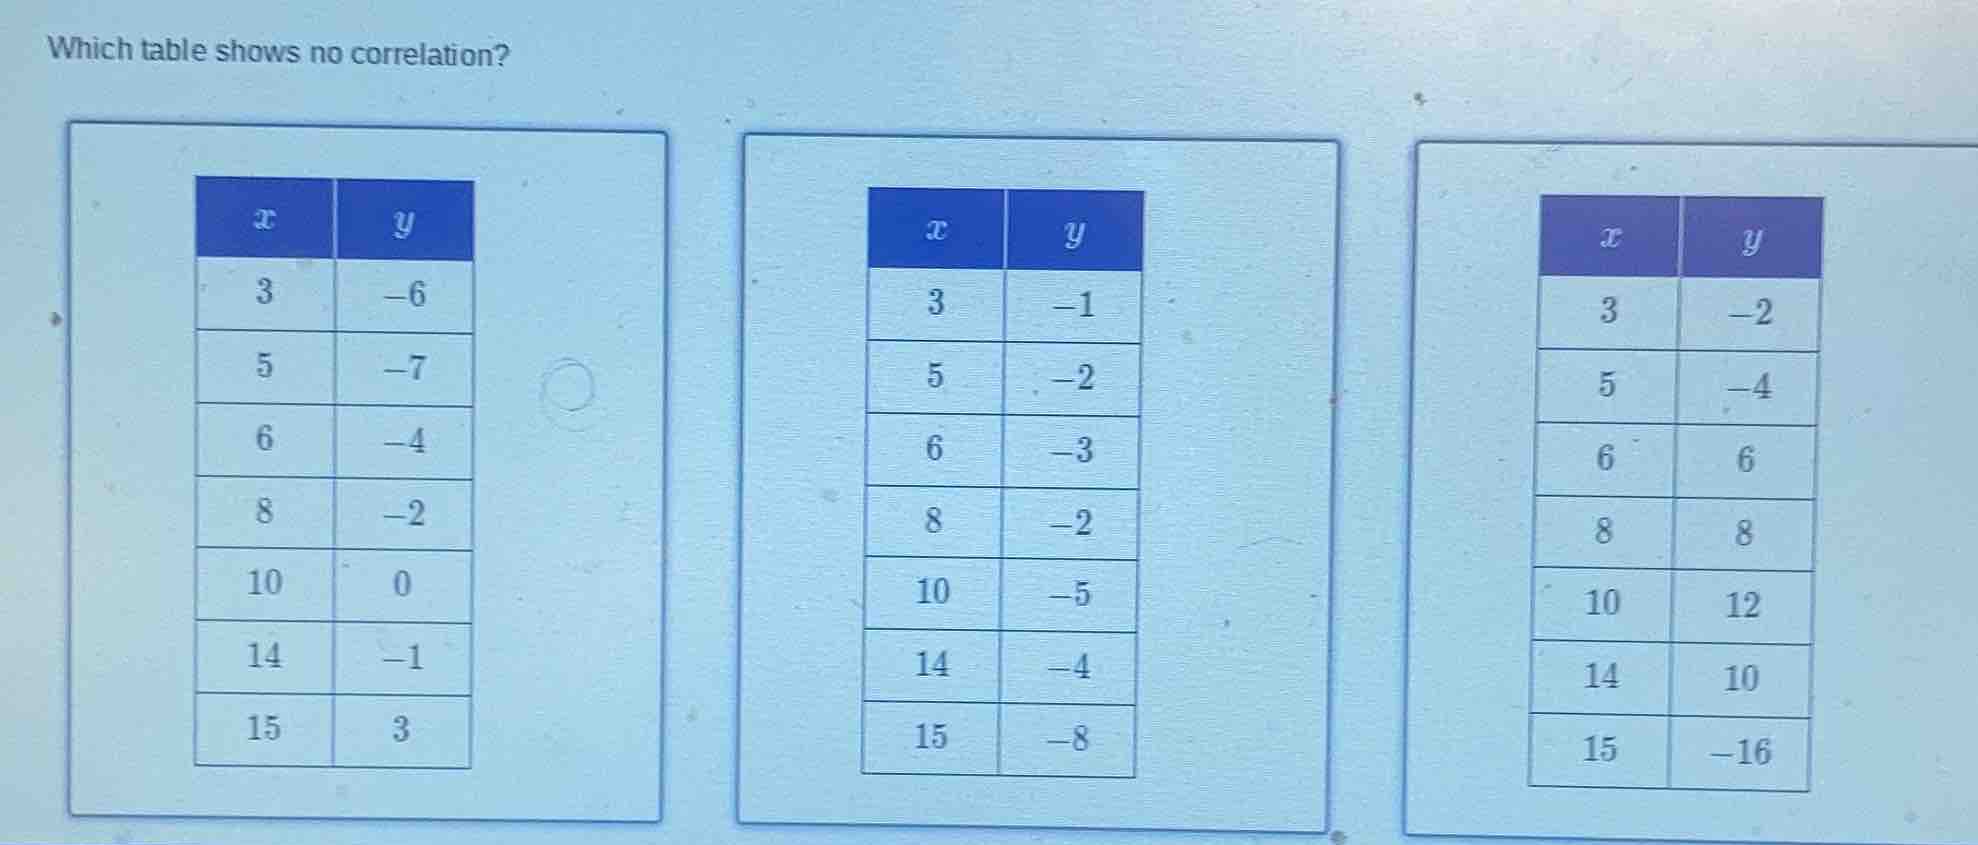
which table shows no correlation?\
\
first table:\
| x | y | \ |
| ---- | ---- | \ |
| 3 | -6 | \ |
| 5 | -7 | \ |
| 6 | -4 | \ |
| 8 | -2 | \ |
| 10 | 0 | \ |
| 14 | -1 | \ |
| 15 | 3 | \ |
\
second table:\
| x | y | \ |
| ---- | ---- | \ |
| 3 | -1 | \ |
| 5 | -2 | \ |
| 6 | -3 | \ |
| 8 | -2 | \ |
| 10 | -5 | \ |
| 14 | -4 | \ |
| 15 | -8 | \ |
\
third table:\
| x | y | \ |
| ---- | ---- | \ |
| 3 | -2 | \ |
| 5 | -4 | \ |
| 6 | 6 | \ |
| 8 | 8 | \ |
| 10 | 12 | \ |
| 14 | 10 | \ |
| 15 | -16 |
Step1: Analyze Correlation Pattern
Correlation (linear) is about a trend in \(x\) and \(y\) values. For positive/negative correlation, \(y\) generally increases/decreases with \(x\). For no correlation, \(y\) has no clear trend with \(x\).
Step2: Examine First Table
- \(x\) increases: \(3,5,6,8,10,14,15\)
- \(y\) values: \(-6,-7,-4,-2,0,-1,3\). As \(x\) increases, \(y\) shows a vague upward trend (from negative to positive), maybe weak positive correlation.
Step3: Examine Second Table
- \(x\) increases: \(3,5,6,8,10,14,15\)
- \(y\) values: \(-1,-2,-3,-2,-5,-4,-8\). No consistent upward/downward trend (e.g., \(x\) from 8 to 10, \(y\) drops; 10 to 14, \(y\) rises; 14 to 15, \(y\) drops).
Step4: Examine Third Table
- \(x\) increases: \(3,5,6,8,10,14,15\)
- \(y\) values: \(-2,-4,6,8,12,10,-16\). No clear linear trend (large fluctuations, no consistent rise/fall). Wait, recheck: Wait, first table: \(x\) up, \(y\) starts low, then rises. Second: \(y\) jumps randomly. Third: \(y\) has big swings. Wait, correction: Wait, the key is "no correlation" (no linear trend). Let's check the second table again. Wait, maybe I made a mistake. Wait, the first table: as \(x\) increases, \(y\) goes from -6 to 3 (overall upward). Third table: \(x\) 3→5→6→8→10→14→15, \(y\) -2→-4→6→8→12→10→-16. That's a big swing (up then down). But the second table: \(x\) 3→5→6→8→10→14→15, \(y\) -1→-2→-3→-2→-5→-4→-8. The \(y\) values have no clear upward/downward (drops, then rises, then drops). Wait, maybe the second table? Wait, no—wait, the first table: let's plot mentally. \(x=3,y=-6\); \(x=5,y=-7\) (slight drop), then \(x=6,y=-4\) (rise), \(x=8,y=-2\) (rise), \(x=10,y=0\) (rise), \(x=14,y=-1\) (drop), \(x=15,y=3\) (rise). So some fluctuations but overall upward. The second table: \(x=3,y=-1\); \(x=5,y=-2\) (drop), \(x=6,y=-3\) (drop), \(x=8,y=-2\) (rise), \(x=10,y=-5\) (drop), \(x=14,y=-4\) (rise), \(x=15,y=-8\) (drop). No consistent trend. The third table: \(x=3,y=-2\); \(x=5,y=-4\) (drop), \(x=6,y=6\) (big rise), \(x=8,y=8\) (rise), \(x=10,y=12\) (rise), \(x=14,y=10\) (drop), \(x=15,y=-16\) (big drop). But the question is "which table shows no correlation". Wait, maybe the second table? Wait, no—wait, the first table has a weak positive trend (overall \(y\) increases as \(x\) increases, despite fluctuations). The second table: \(y\) has no consistent direction (drops, rises, drops). The third table: \(y\) has extreme fluctuations but maybe no linear trend. Wait, the correct approach: A table with no correlation has \(y\) values that don't follow a linear (up/down) pattern with \(x\). Let's check the first table: \(x\) from 3 to 15 (increases), \(y\) from -6 to 3 (overall increases) → weak positive. Second table: \(y\) values: -1, -2, -3, -2, -5, -4, -8. No clear up/down (e.g., \(x=8\) to \(x=10\): \(y\) from -2 to -5 (down); \(x=10\) to \(x=14\): \(y\) from -5 to -4 (up); \(x=14\) to \(x=15\): \(y\) from -4 to -8 (down)). So no linear trend. Third table: \(y\) from -2 to -4 (down), then 6 (up), 8 (up), 12 (up), 10 (down), -16 (down). But the second table's \(y\) is more random. Wait, maybe the second table? Wait, the problem's tables: let's list all \(x,y\) for each:
Table 1:
\(x\): 3,5,6,8,10,14,15
\(y\): -6,-7,-4,-2,0,-1,3
Table 2:
\(x\): 3,5,6,8,10,14,15
\(y\): -1,-2,-3,-2,-5,-4,-8
Table 3:
\(x\): 3,5,6,8,10,14,15
\(y\): -2,-4,6,8,12,10,-16
Now, check linear correlation (slope). For Table 1: Let's compute slope between first and last: \(\frac{3 - (-6)}{15 - 3} = \frac{9}{12} = 0.75\) (positive). For Table 2: \(\frac{-8 - (-1)}{15 - 3} = \frac{-7…

Snap & solve any problem in the app
Get step-by-step solutions on Sovi AI
Photo-based solutions with guided steps
Explore more problems and detailed explanations
The middle table (with \(x\) and \(y\) values: 3/-1, 5/-2, 6/-3, 8/-2, 10/-5, 14/-4, 15/-8) shows no correlation.