QUESTION IMAGE
Question
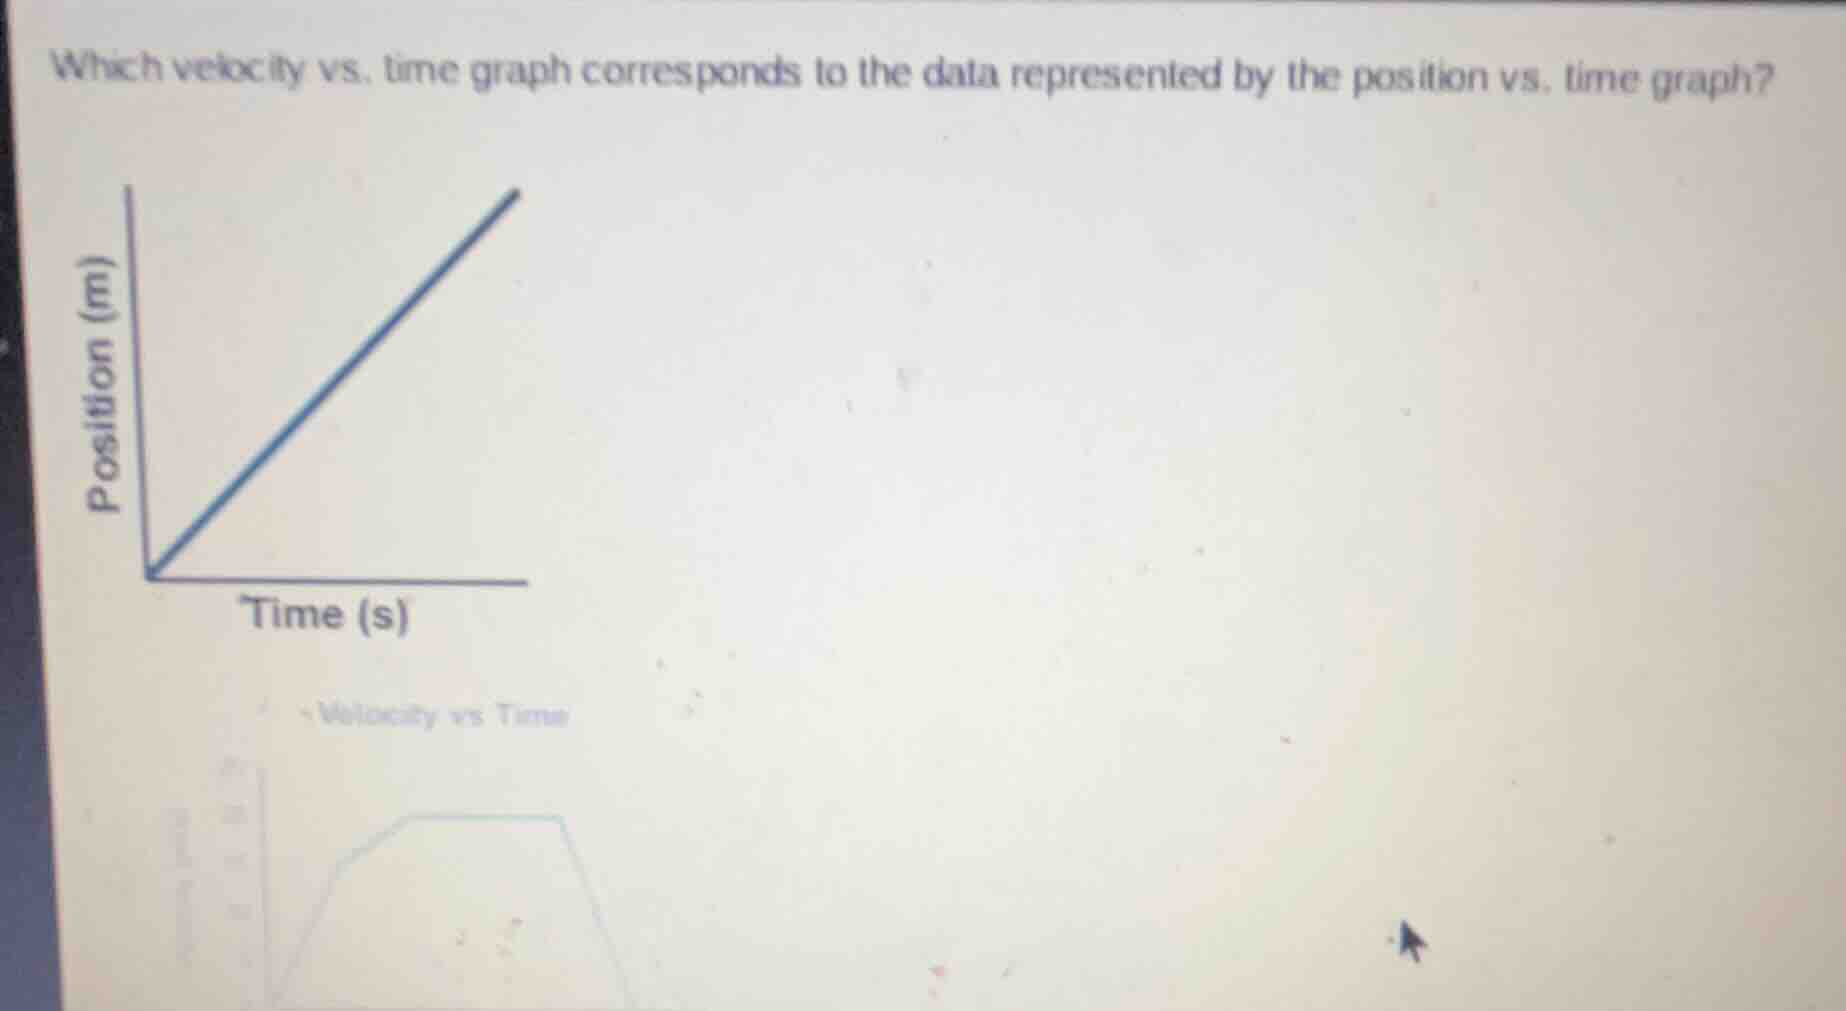
which velocity vs. time graph corresponds to the data represented by the position vs. time graph? position (m) time (s) velocity vs time
Step1: Analyze Position - Time Graph
The position - time graph is a straight line passing through the origin. The slope of a position - time graph gives the velocity. For a straight - line position - time graph \(x(t)=vt\) (where \(x\) is position, \(v\) is velocity, and \(t\) is time), the slope \(v = \frac{\Delta x}{\Delta t}\) is constant.
Step2: Determine Velocity - Time Graph
Since the velocity \(v\) is constant (does not change with time), the velocity - time graph should be a horizontal line (a line with zero slope) parallel to the time axis. This is because velocity is independent of time when the position - time graph has a constant slope.

Snap & solve any problem in the app
Get step-by-step solutions on Sovi AI
Photo-based solutions with guided steps
Explore more problems and detailed explanations
The velocity - time graph corresponding to the given position - time graph is a horizontal line (constant velocity) parallel to the time axis. (If there were options, the one with a horizontal line representing constant velocity would be the correct answer.)