QUESTION IMAGE
Question
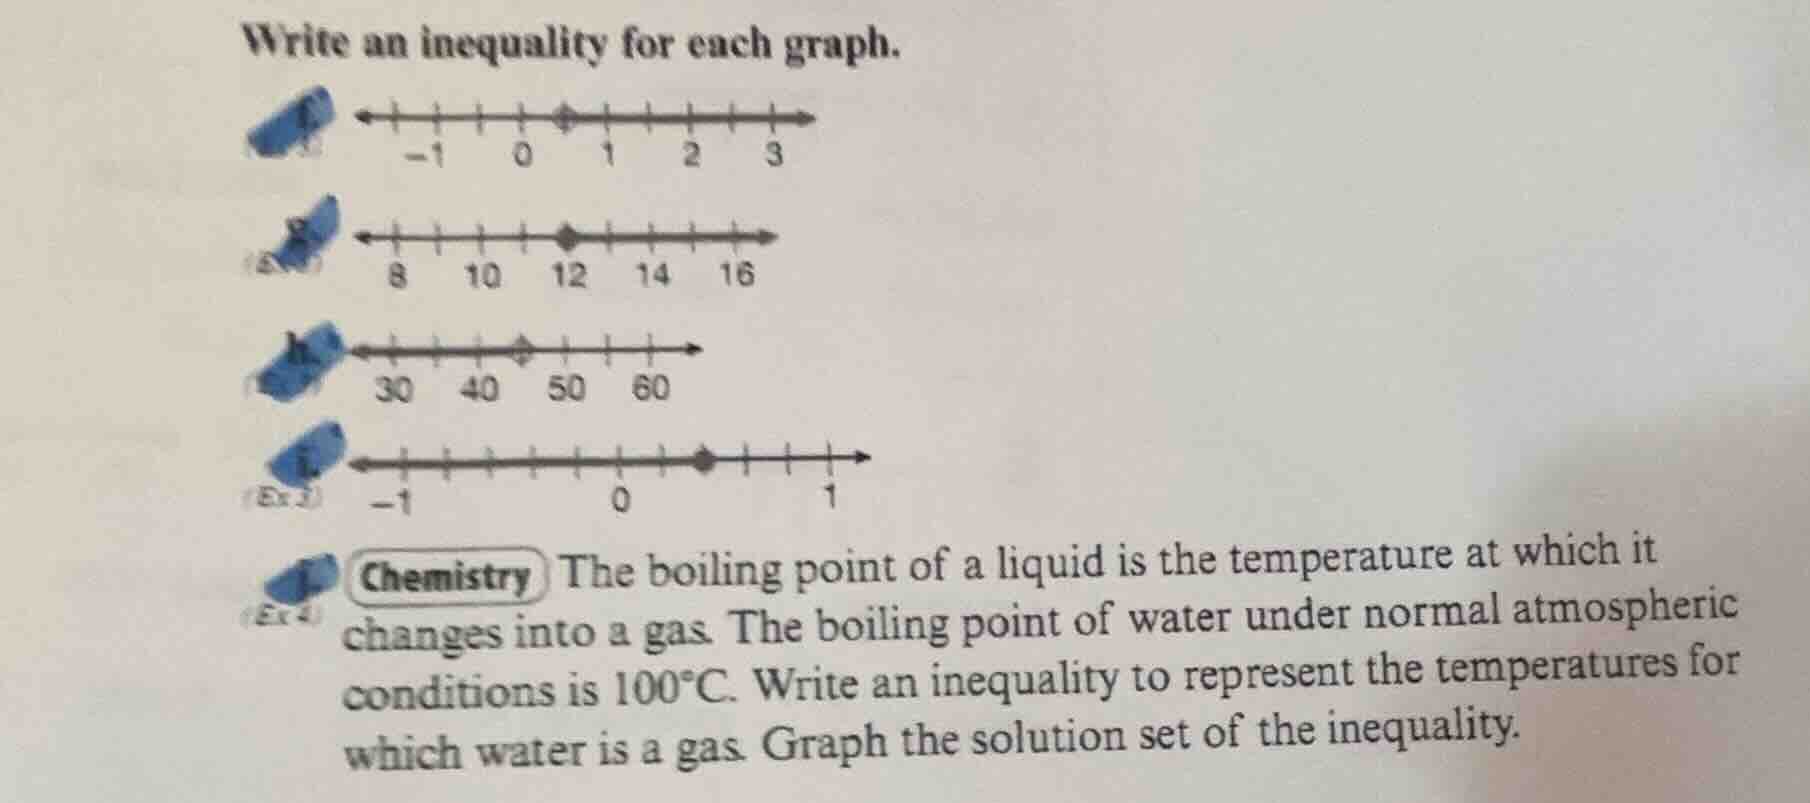
write an inequality for each graph.
chemistry the boiling point of a liquid is the temperature at which it changes into a gas. the boiling point of water under normal atmospheric conditions is 100°c. write an inequality to represent the temperatures for which water is a gas. graph the solution set of the inequality.
Response
First Graph (Top - Open Circle at 0.5? Wait, looking at the first number line: marks at -1, 0, 1, 2, 3. Open circle between 0 and 1, say at 0.5? Wait, maybe it's at 0.5? Wait, no, the first graph: let's see the ticks. From -1, 0, 1, 2, 3. The open circle is at 0.5? Wait, maybe it's at 0.5, and the arrow is to the right? Wait, no, the first graph's arrow: the blue mark, then the number line. Wait, maybe the first graph: open circle at 0.5 (between 0 and 1), and the arrow is to the right? Wait, no, let's check each:
1. First Graph (Top):
- Number line: -1, 0, 1, 2, 3. Open circle (hollow dot) between 0 and 1 (let's say at \( x = 0.5 \)? Wait, maybe it's at \( x = 0.5 \), but maybe the actual value is \( x > 0.5 \)? Wait, no, maybe the open circle is at \( x = 0.5 \), but let's see the standard: open circle means not included, arrow direction. Wait, maybe the first graph: open circle at \( x = 0.5 \), arrow to the right? Wait, no, the first graph's number line: the open circle is at 0.5 (between 0 and 1), and the arrow is to the right? Wait, maybe I misread. Wait, the first graph: let's see the ticks. From -1, 0, 1, 2, 3. The open circle is at 0.5, and the arrow is to the right? So the inequality is \( x > 0.5 \)? Wait, no, maybe it's at \( x = 0.5 \), but maybe the actual value is \( x > 0.5 \). Wait, maybe the first graph: open circle at \( x = 0.5 \), arrow right: \( x > 0.5 \).
2. Second Graph (Middle - Filled Circle at 12):
- Number line: 8, 10, 12, 14, 16. Filled circle (solid dot) at 12, arrow to the right. So inequality: \( x \geq 12 \).
3. Third Graph (Middle - Open Circle at 45?):
- Number line: 30, 40, 50, 60. Open circle between 40 and 50 (say 45), arrow to the left? Wait, the blue mark, then the number line. Wait, the third graph: open circle at 45 (between 40 and 50), arrow to the left? So inequality: \( x < 45 \).
4. Fourth Graph (Ex 2):
- Number line: -1, 0, 1. Filled circle between 0 and 1 (say at 0.5), arrow to the left? Wait, no, the fourth graph: filled circle, arrow to the left. So inequality: \( x \leq 0.5 \) (assuming the filled circle is at 0.5).
Chemistry Problem (Ex 4):
- Boiling point of water is \( 100^\circ \text{C} \). At or above this temperature, water is gas. So temperature \( t \) (in \( ^\circ \text{C} \)): \( t \geq 100 \).
Let's handle each:
1. First Graph (Top - Open Circle, Arrow Right):
- Step 1: Identify the critical point. The open circle is at \( x = 0.5 \) (between 0 and 1). Open circle means the point is not included.
- Step 2: Arrow direction: to the right, so values greater than 0.5. So inequality: \( x > 0.5 \). Wait, but maybe the open circle is at \( x = 0.5 \), but let's check the number line ticks. Wait, maybe the first graph is at \( x = 0.5 \), but perhaps the actual value is \( x > 0.5 \).
2. Second Graph (Filled Circle at 12, Arrow Right):
- Step 1: Critical point is 12, filled circle (included).
- Step 2: Arrow right, so \( x \geq 12 \).
3. Third Graph (Open Circle at 45, Arrow Left):
- Step 1: Critical point 45 (between 40 and 50), open circle (not included).
- Step 2: Arrow left, so \( x < 45 \).
4. Fourth Graph (Filled Circle at 0.5, Arrow Left):
- Step 1: Critical point 0.5 (between 0 and 1), filled circle (included).
- Step 2: Arrow left, so \( x \leq 0.5 \).
Chemistry Problem (Ex 4):
- Step 1: Define variable: let \( t \) be temperature in \( ^\circ \text{C} \).
- Step 2: Boiling point is \( 100^\circ \text{C} \). At or above this, water is gas. So \( t \geq 100 \).
- To graph: Draw a number line, mark 100…
Step1: Identify critical point (open circle) at \( x = 0.5 \).
Open circle means \( 0.5 \) is not included.
Step2: Arrow direction (right) means values > 0.5.
Thus, \( x > 0.5 \).
Step1: Critical point (filled circle) at \( x = 12 \).
Filled circle means \( 12 \) is included.
Step2: Arrow direction (right) means values ≥ 12.
Thus, \( x \geq 12 \).
Step1: Critical point (open circle) at \( x = 45 \).
Open circle means \( 45 \) is not included.
Step2: Arrow direction (left) means values < 45.
Thus, \( x < 45 \).

Snap & solve any problem in the app
Get step-by-step solutions on Sovi AI
Photo-based solutions with guided steps
Explore more problems and detailed explanations
\( x > 0.5 \)