QUESTION IMAGE
Question
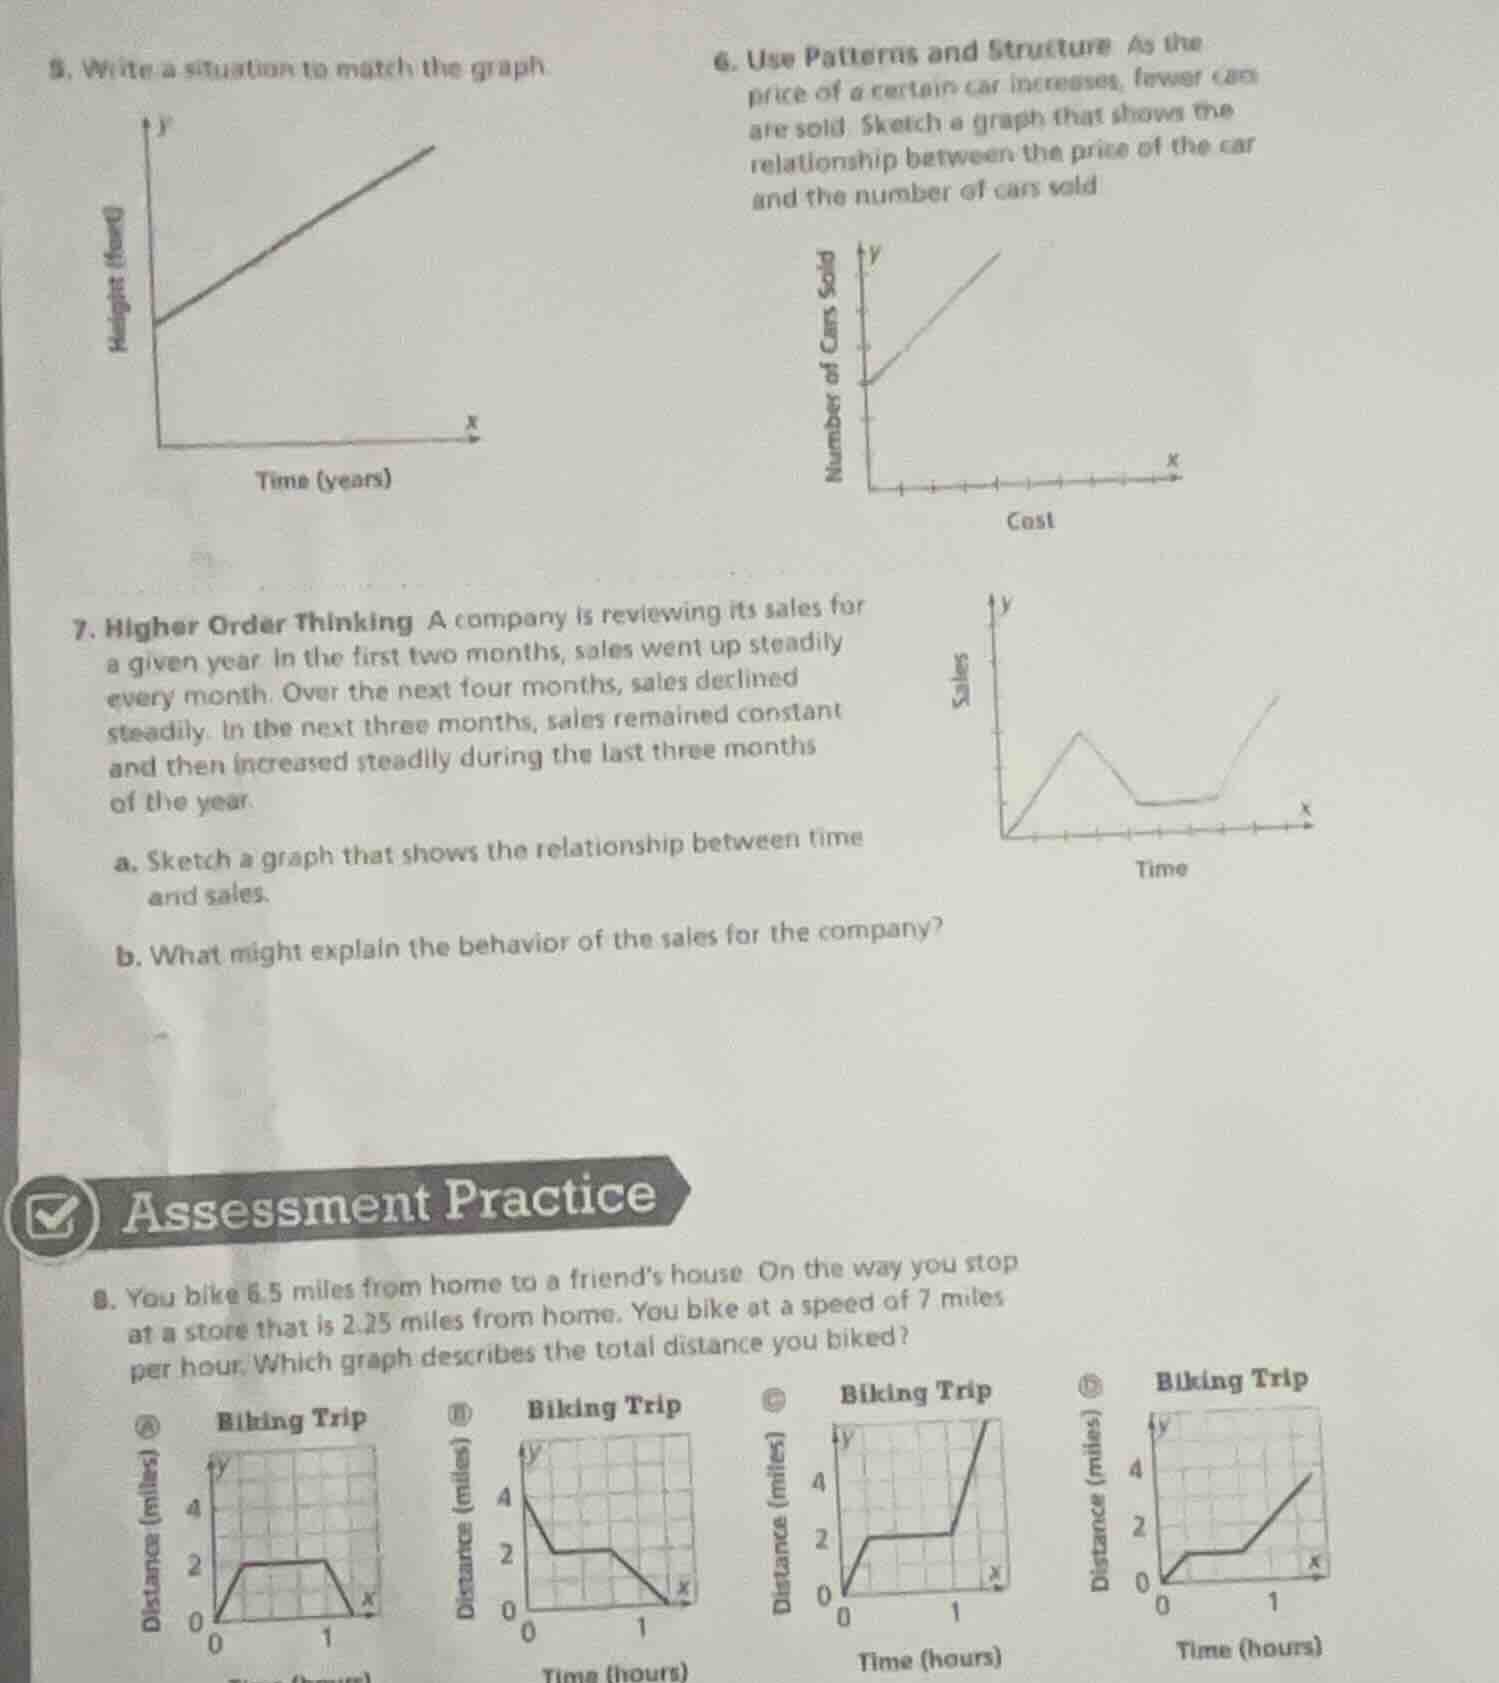
- write a situation to match the graph
- use patterns and structure as the price of a certain car increases, fewer cars are sold. sketch a graph that shows the relationship between the price of the car and the number of cars sold
- higher order thinking a company is reviewing its sales for a given year. in the first two months, sales went up steadily every month. over the next four months, sales declined steadily. in the next three months, sales remained constant and then increased steadily during the last three months of the year.
a. sketch a graph that shows the relationship between time and sales.
b. what might explain the behavior of the sales for the company?
assessment practice
- you bike 5.5 miles from home to a friend’s house. on the way you stop at a store that is 2.25 miles from home. you bike at a speed of 7 miles per hour. which graph describes the total distance you biked?
a biking trip
b biking trip
c biking trip
d biking trip
Question 8 Solution:
Step 1: Calculate time to store
Time to store: $t_1 = \frac{2.25}{7}$ hours. Distance increases to 2.25 miles.
Step 2: Time at store
Distance remains 2.25 miles (horizontal line) for some time (stop at store).
Step 3: Time from store to friend's
Remaining distance: $6.5 - 2.25 = 4.25$ miles. Time: $t_2 = \frac{4.25}{7}$ hours. Distance increases from 2.25 to 6.5 miles.
Step 4: Analyze graphs
- Graph A: Distance decreases, incorrect.
- Graph B: Distance decreases, incorrect.
- Graph C: Final distance jump too big, incorrect.
- Graph D: Increases to ~2.25, stops, then increases (matches: start, stop at store, continue).
Step 1: First 2 months
Draw a line with positive slope (sales up steadily) from (0, 0) to (2, $S_1$) (S₁ > 0).
Step 2: Next 4 months
Draw a line with negative slope (sales down steadily) from (2, $S_1$) to (6, $S_2$) (S₂ < S₁).
Step 3: Next 3 months
Draw a horizontal line (sales constant) from (6, $S_2$) to (9, $S_2$).
Step 4: Last 3 months
Draw a line with positive slope (sales up steadily) from (9, $S_2$) to (12, $S_3$) (S₃ > S₂, could exceed S₁).
- First 2 months: New product launch, marketing boosts sales.
- Months 3–6: Competition enters, demand drops (sales decline).
- Months 7–9: Market stabilizes, sales flat (no new info, steady demand).
- Months 10–12: Holiday season/promotions, sales rise again.

Snap & solve any problem in the app
Get step-by-step solutions on Sovi AI
Photo-based solutions with guided steps
Explore more problems and detailed explanations
D. Biking Trip (graph with distance starting at 0, increasing to ~2.25, flat, then increasing)