QUESTION IMAGE
Question
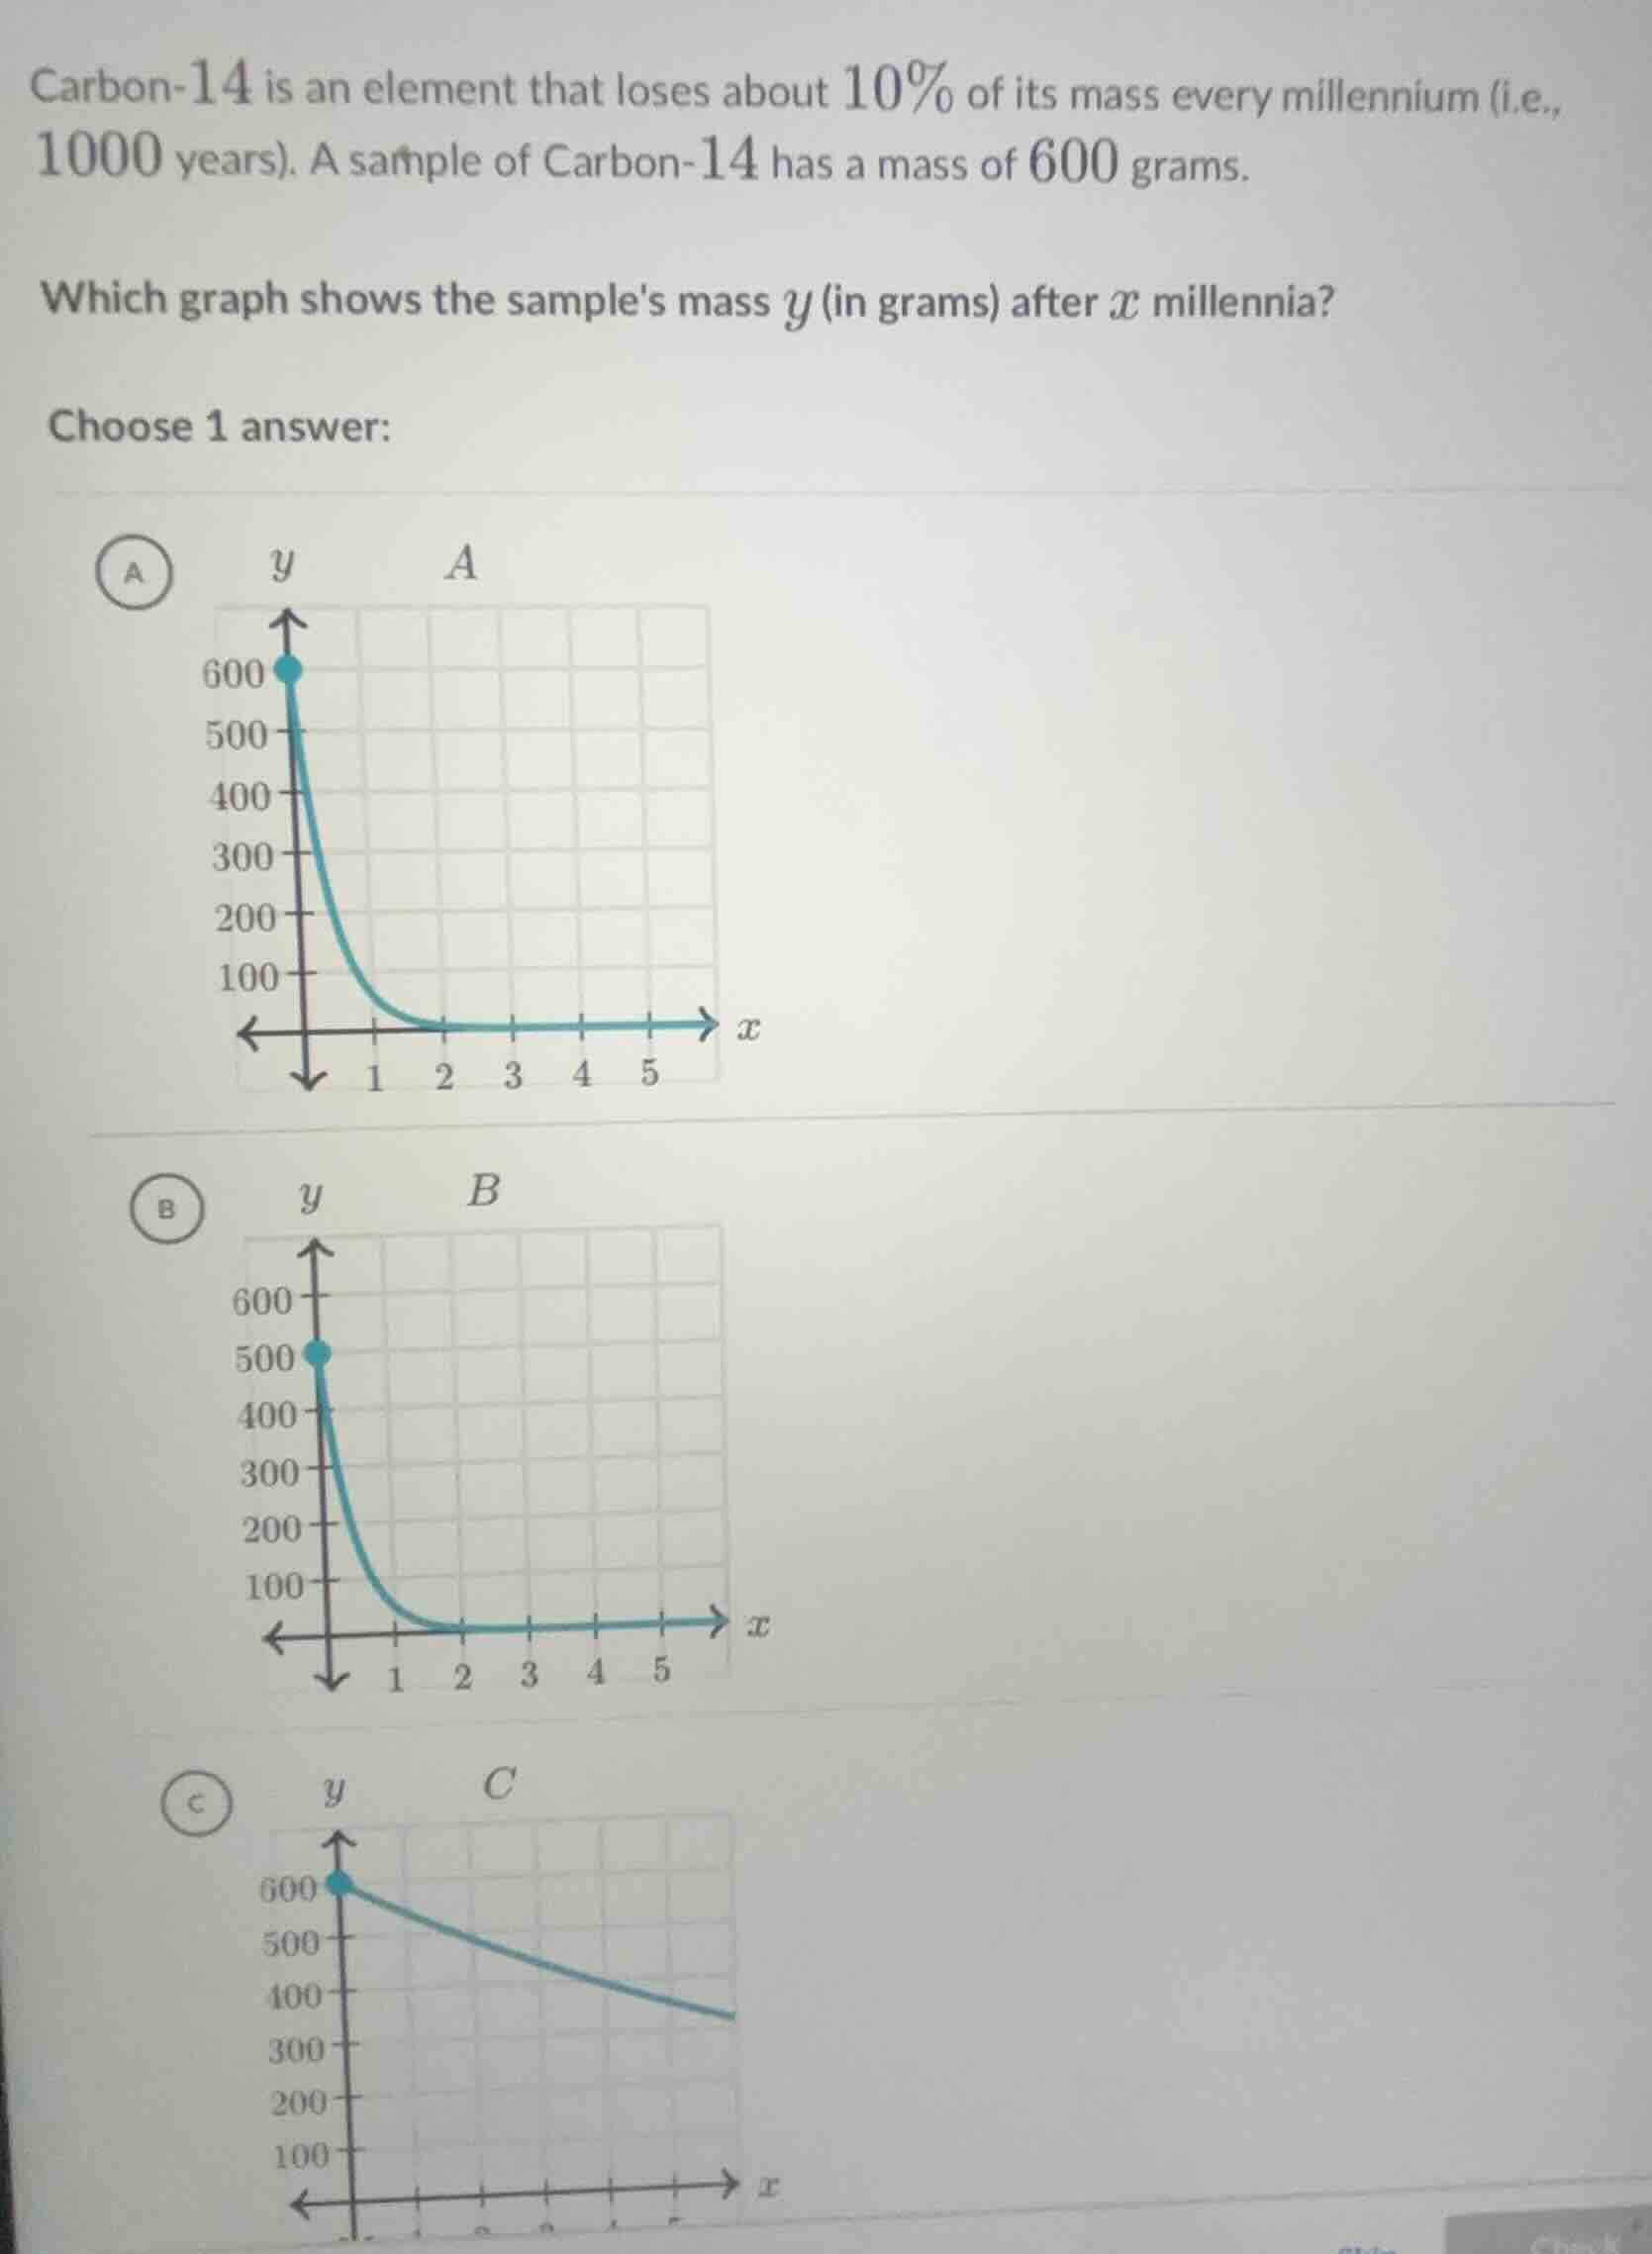
carbon-14 is an element that loses about 10% of its mass every millennium (i.e., 1000 years). a sample of carbon-14 has a mass of 600 grams. which graph shows the samples mass y (in grams) after x millennia? choose 1 answer:
Step1: Identify initial mass
When $x=0$ (0 millennia), the mass $y=600$ grams. This eliminates option B, which starts at 500 grams.
Step2: Identify decay type
Carbon-14 loses 10% of its mass each millennium, so it follows exponential decay (not linear decay). The formula for the mass is $y = 600(0.9)^x$, where $0.9$ is the remaining mass fraction per millennium. Linear decay (option C) would lose a fixed 60 grams per millennium, which does not match the 10% proportional loss.
Step3: Verify exponential decay shape
Exponential decay graphs start at the initial value and decrease rapidly at first, then slow down, approaching but never reaching 0. This matches the shape of graph A.

Snap & solve any problem in the app
Get step-by-step solutions on Sovi AI
Photo-based solutions with guided steps
Explore more problems and detailed explanations
A. The graph starting at (0, 600) with an exponential decay curve decreasing rapidly then approaching 0