QUESTION IMAGE
Question
the minimum of the data is
the first quartile is
the median of the data is
the third quartile is
the maximum of the data is
done
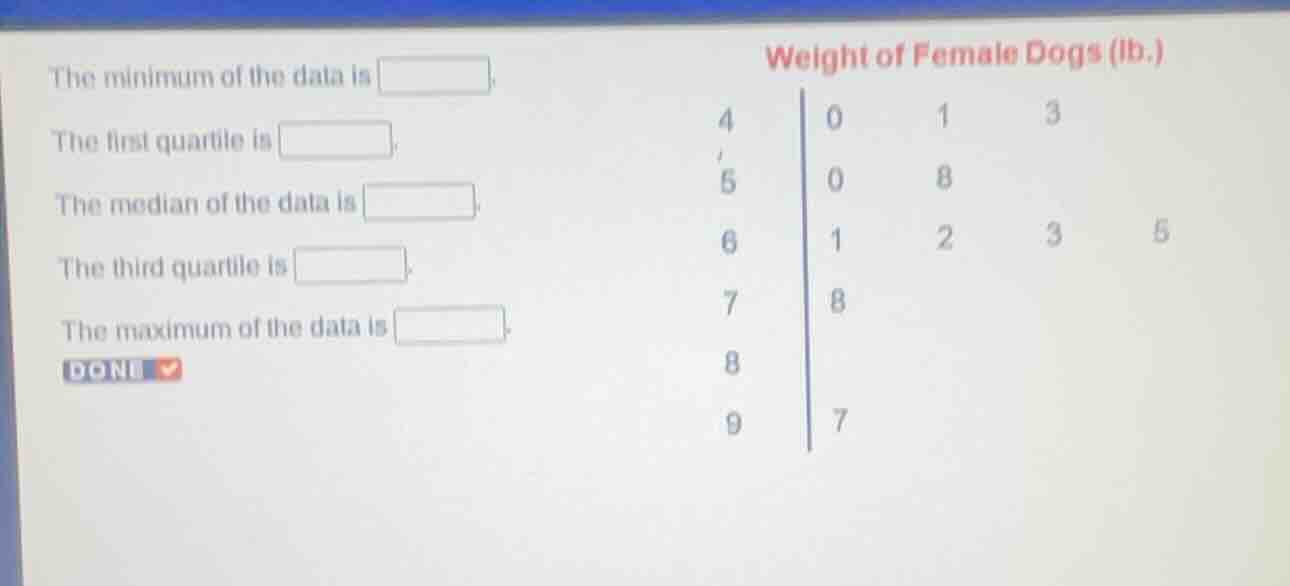
weight of female dogs (lb.)
4 | 0 1 3
5 | 0 8
6 | 1 2 3 5
7 | 8
8 |
9 | 7
Step1: List all data values
From the stem-and-leaf plot, the data is: 40, 41, 43, 50, 58, 61, 62, 63, 65, 78, 97
Step2: Find minimum value
The smallest value in the dataset is the first entry.
Minimum = 40
Step3: Find median (2nd quartile)
There are 11 data points. The median is the $\frac{11+1}{2}=6$th value.
6th value: 61
Step4: Find first quartile (Q1)
Q1 is the median of the lower half (first 5 values: 40,41,43,50,58), which is the 3rd value.
Q1 = 43
Step5: Find third quartile (Q3)
Q3 is the median of the upper half (last 5 values: 62,63,65,78,97), which is the 3rd value of this subset.
Q3 = 65
Step6: Find maximum value
The largest value in the dataset is the last entry.
Maximum = 97

Snap & solve any problem in the app
Get step-by-step solutions on Sovi AI
Photo-based solutions with guided steps
Explore more problems and detailed explanations
The minimum of the data is 40
The first quartile is 43
The median of the data is 61
The third quartile is 65
The maximum of the data is 97