QUESTION IMAGE
Question
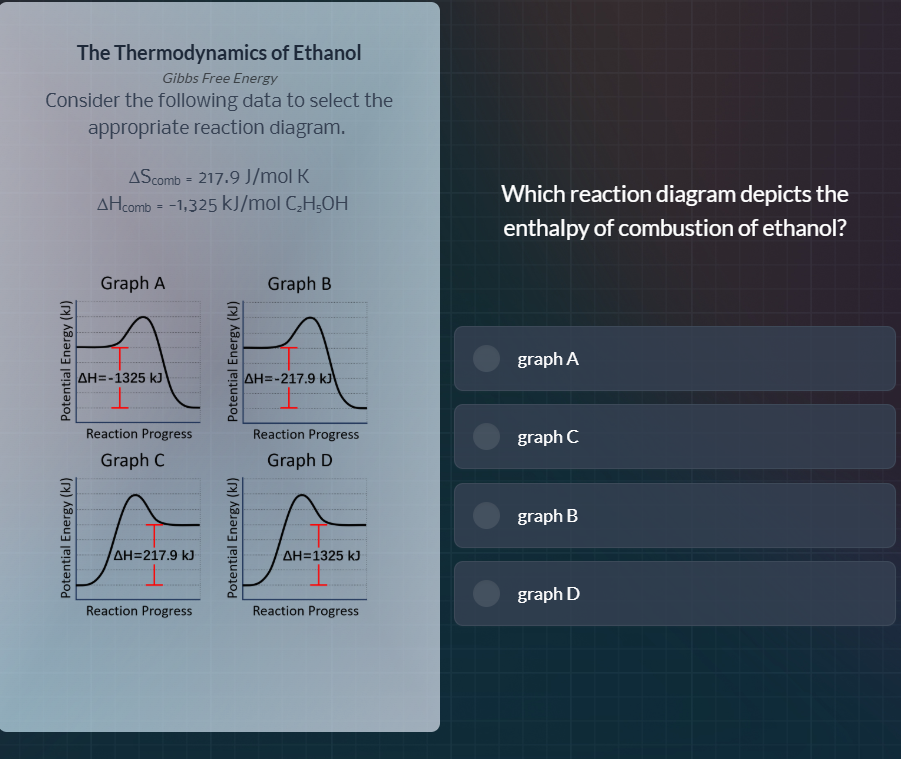
the thermodynamics of ethanol
gibbs free energy
consider the following data to select the
appropriate reaction diagram.
\\(\delta s_{comb} = 217.9\\, j/mol\\, k\\)
\\(\delta h_{comb} = -1,325\\, kj/mol\\, c_2h_5oh\\)
which reaction diagram depicts the
enthalpy of combustion of ethanol?
\\(\quad\\) graph a
\\(\quad\\) graph c
\\(\quad\\) graph b
\\(\quad\\) graph d
The enthalpy of combustion ($\Delta H_{\text{comb}}$) of ethanol is given as -1325 kJ/mol, indicating an exothermic reaction (energy is released, so the products have lower potential energy than reactants). We analyze the graphs:
- Graph A: Shows $\Delta H = -1325$ kJ, with reactants at higher potential energy than products (exothermic, matches $\Delta H_{\text{comb}}$).
- Graph B: $\Delta H = -217.9$ kJ (incorrect value, $\Delta S$ is 217.9 J/mol·K, not $\Delta H$).
- Graph C: $\Delta H = 217.9$ kJ (positive, endothermic, incorrect for combustion).
- Graph D: $\Delta H = 1325$ kJ (positive, endothermic, incorrect for combustion).
Only Graph A has the correct $\Delta H$ value and shows an exothermic reaction (reactants → products with energy decrease).

Snap & solve any problem in the app
Get step-by-step solutions on Sovi AI
Photo-based solutions with guided steps
Explore more problems and detailed explanations
graph A