QUESTION IMAGE
Question
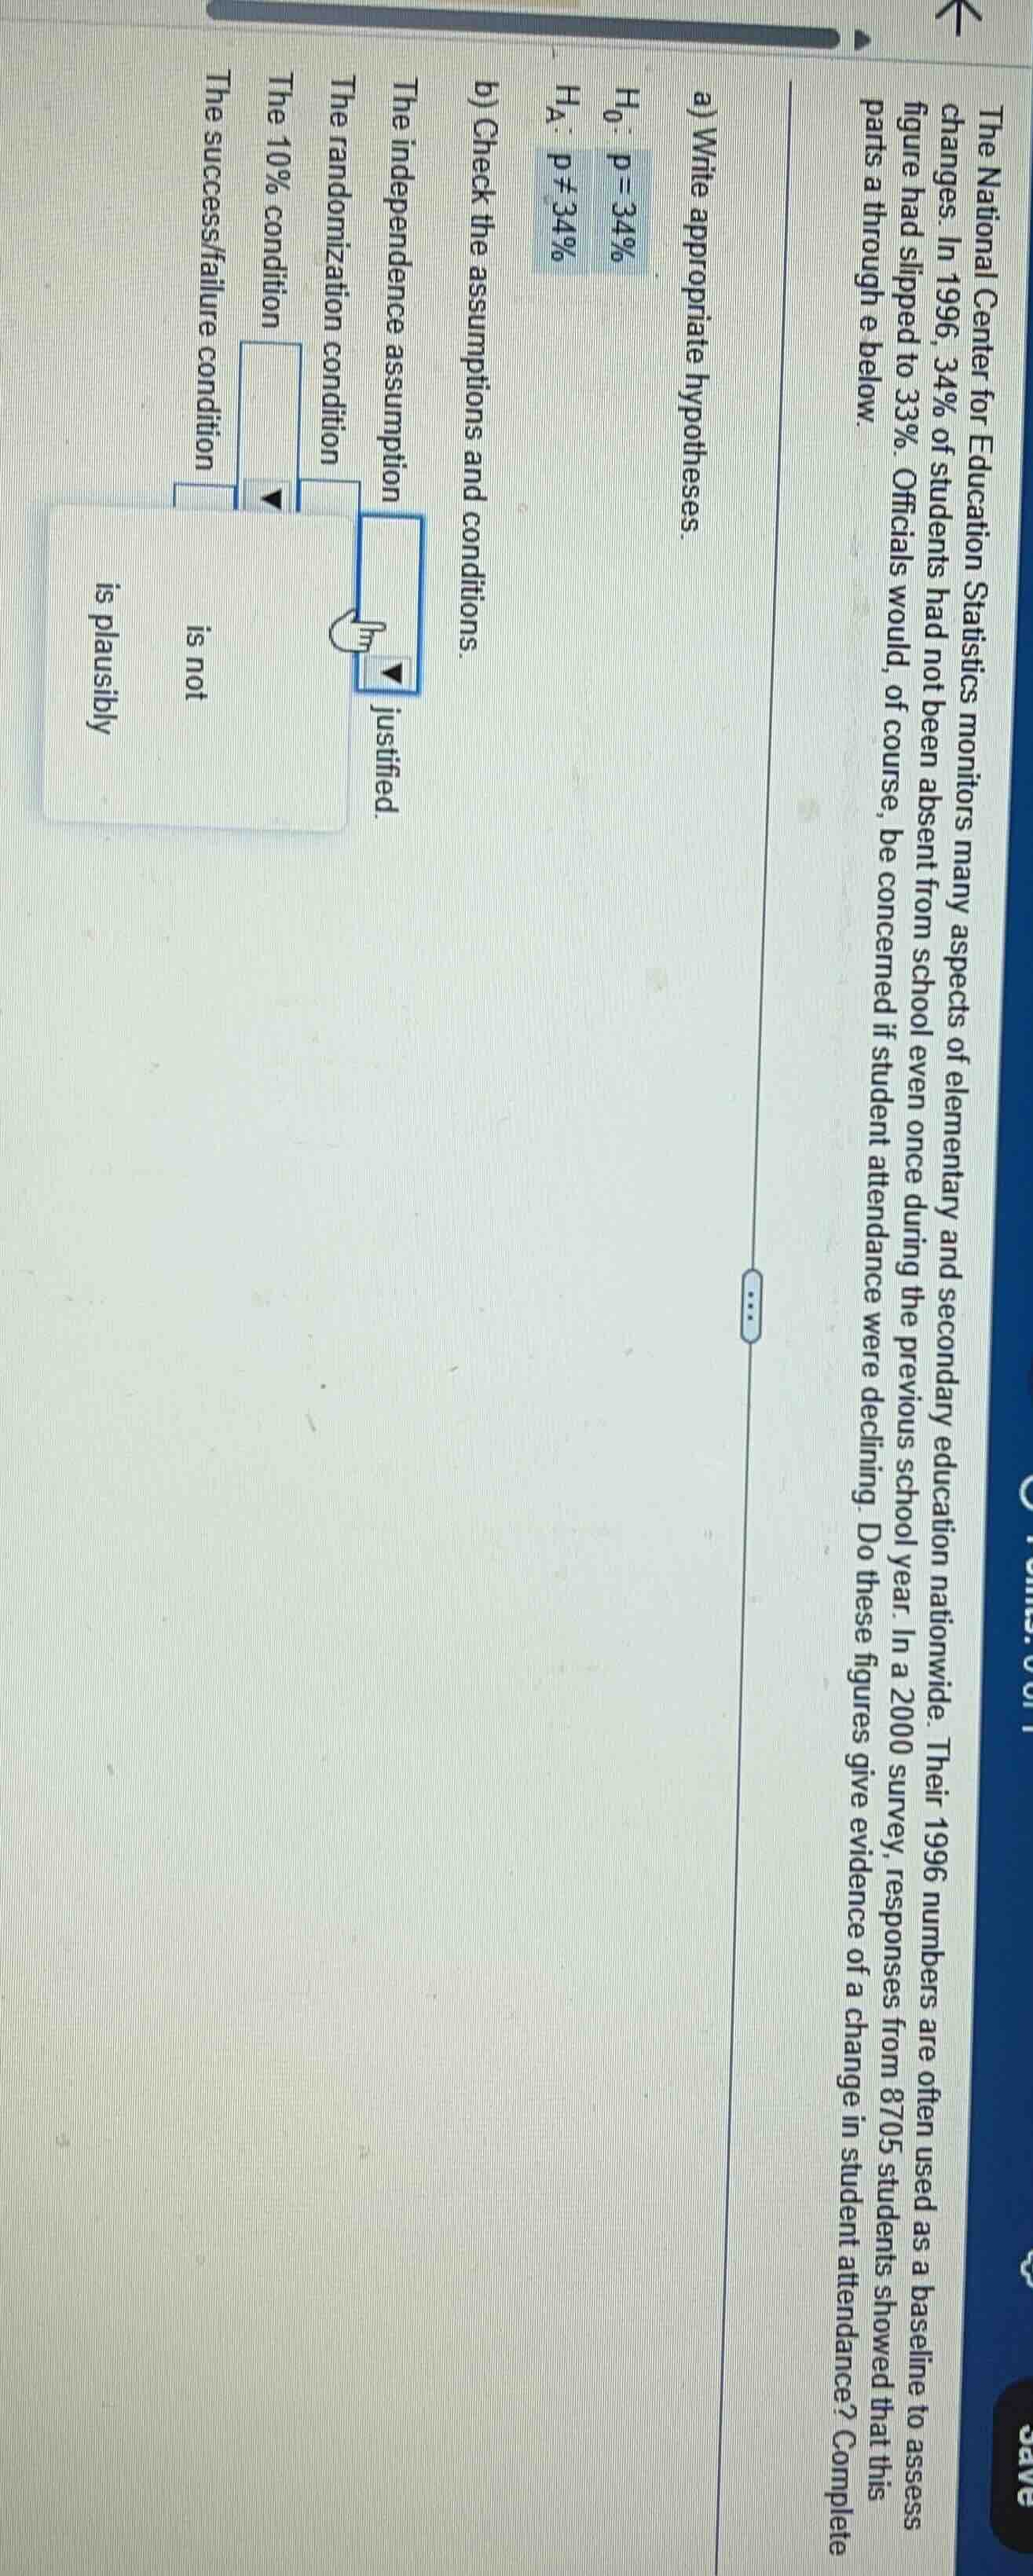
the national center for education statistics monitors many aspects of elementary and secondary education nationwide. their 1996 numbers are often used as a baseline to assess changes. in 1996, 34% of students had not been absent from school even once during the previous school year. in a 2000 survey, responses from 8705 students showed that this figure had slipped to 33%. officials would, of course, be concerned if student attendance were declining. do these figures give evidence of a change in student attendance? complete parts a through e below.
a) write appropriate hypotheses.
$h_0$: $p = 34\\%$
$h_a$: $p \
eq 34\\%$
b) check the assumptions and conditions.
the independence assumption
the randomization condition
the 10% condition
the success/failure condition
Step1: State hypotheses
Let $p$ = proportion of students with no absences.
$H_0: p = 0.34$
$H_A: p
eq 0.34$
Step2: Check independence assumption
The sample is a nationwide survey, so student responses are independent of each other.
Conclusion: is plausibly justified.
Step3: Check 10% condition
Sample size $n=8705$. The population of all US K-12 students is far larger than $10n=87050$.
Conclusion: is plausibly justified.
Step4: Check success/failure condition
Calculate $np_0$ and $n(1-p_0)$:
$np_0 = 8705 \times 0.34 = 2959.7$
$n(1-p_0) = 8705 \times (1-0.34) = 5745.3$
Both values are greater than 10.
Conclusion: is plausibly justified.

Snap & solve any problem in the app
Get step-by-step solutions on Sovi AI
Photo-based solutions with guided steps
Explore more problems and detailed explanations
a) $H_0: p = 0.34$, $H_A: p
eq 0.34$
b)
- The independence assumption: is plausibly justified
- The randomization condition: is plausibly justified (nationwide survey implies random sampling framework)
- The 10% condition: is plausibly justified
- The success/failure condition: is plausibly justified